The Researcher Alignment Matrix
Ever since I decided to get myself involved in academic research two years ago, I’ve spent a lot of time thinking about the habits and behaviours of the different researchers I’ve interacted with. Most researchers are crazy, but they’re crazy in different ways because their actions are driven by different forces.
Understanding your particular brand of influences and craziness as a researcher and comparing it with those of others may help you to understand why your collaborations with some researchers work very well and why others drive you insane. Therefore, I hereby present to you the “Researcher Alignment Matrix”.
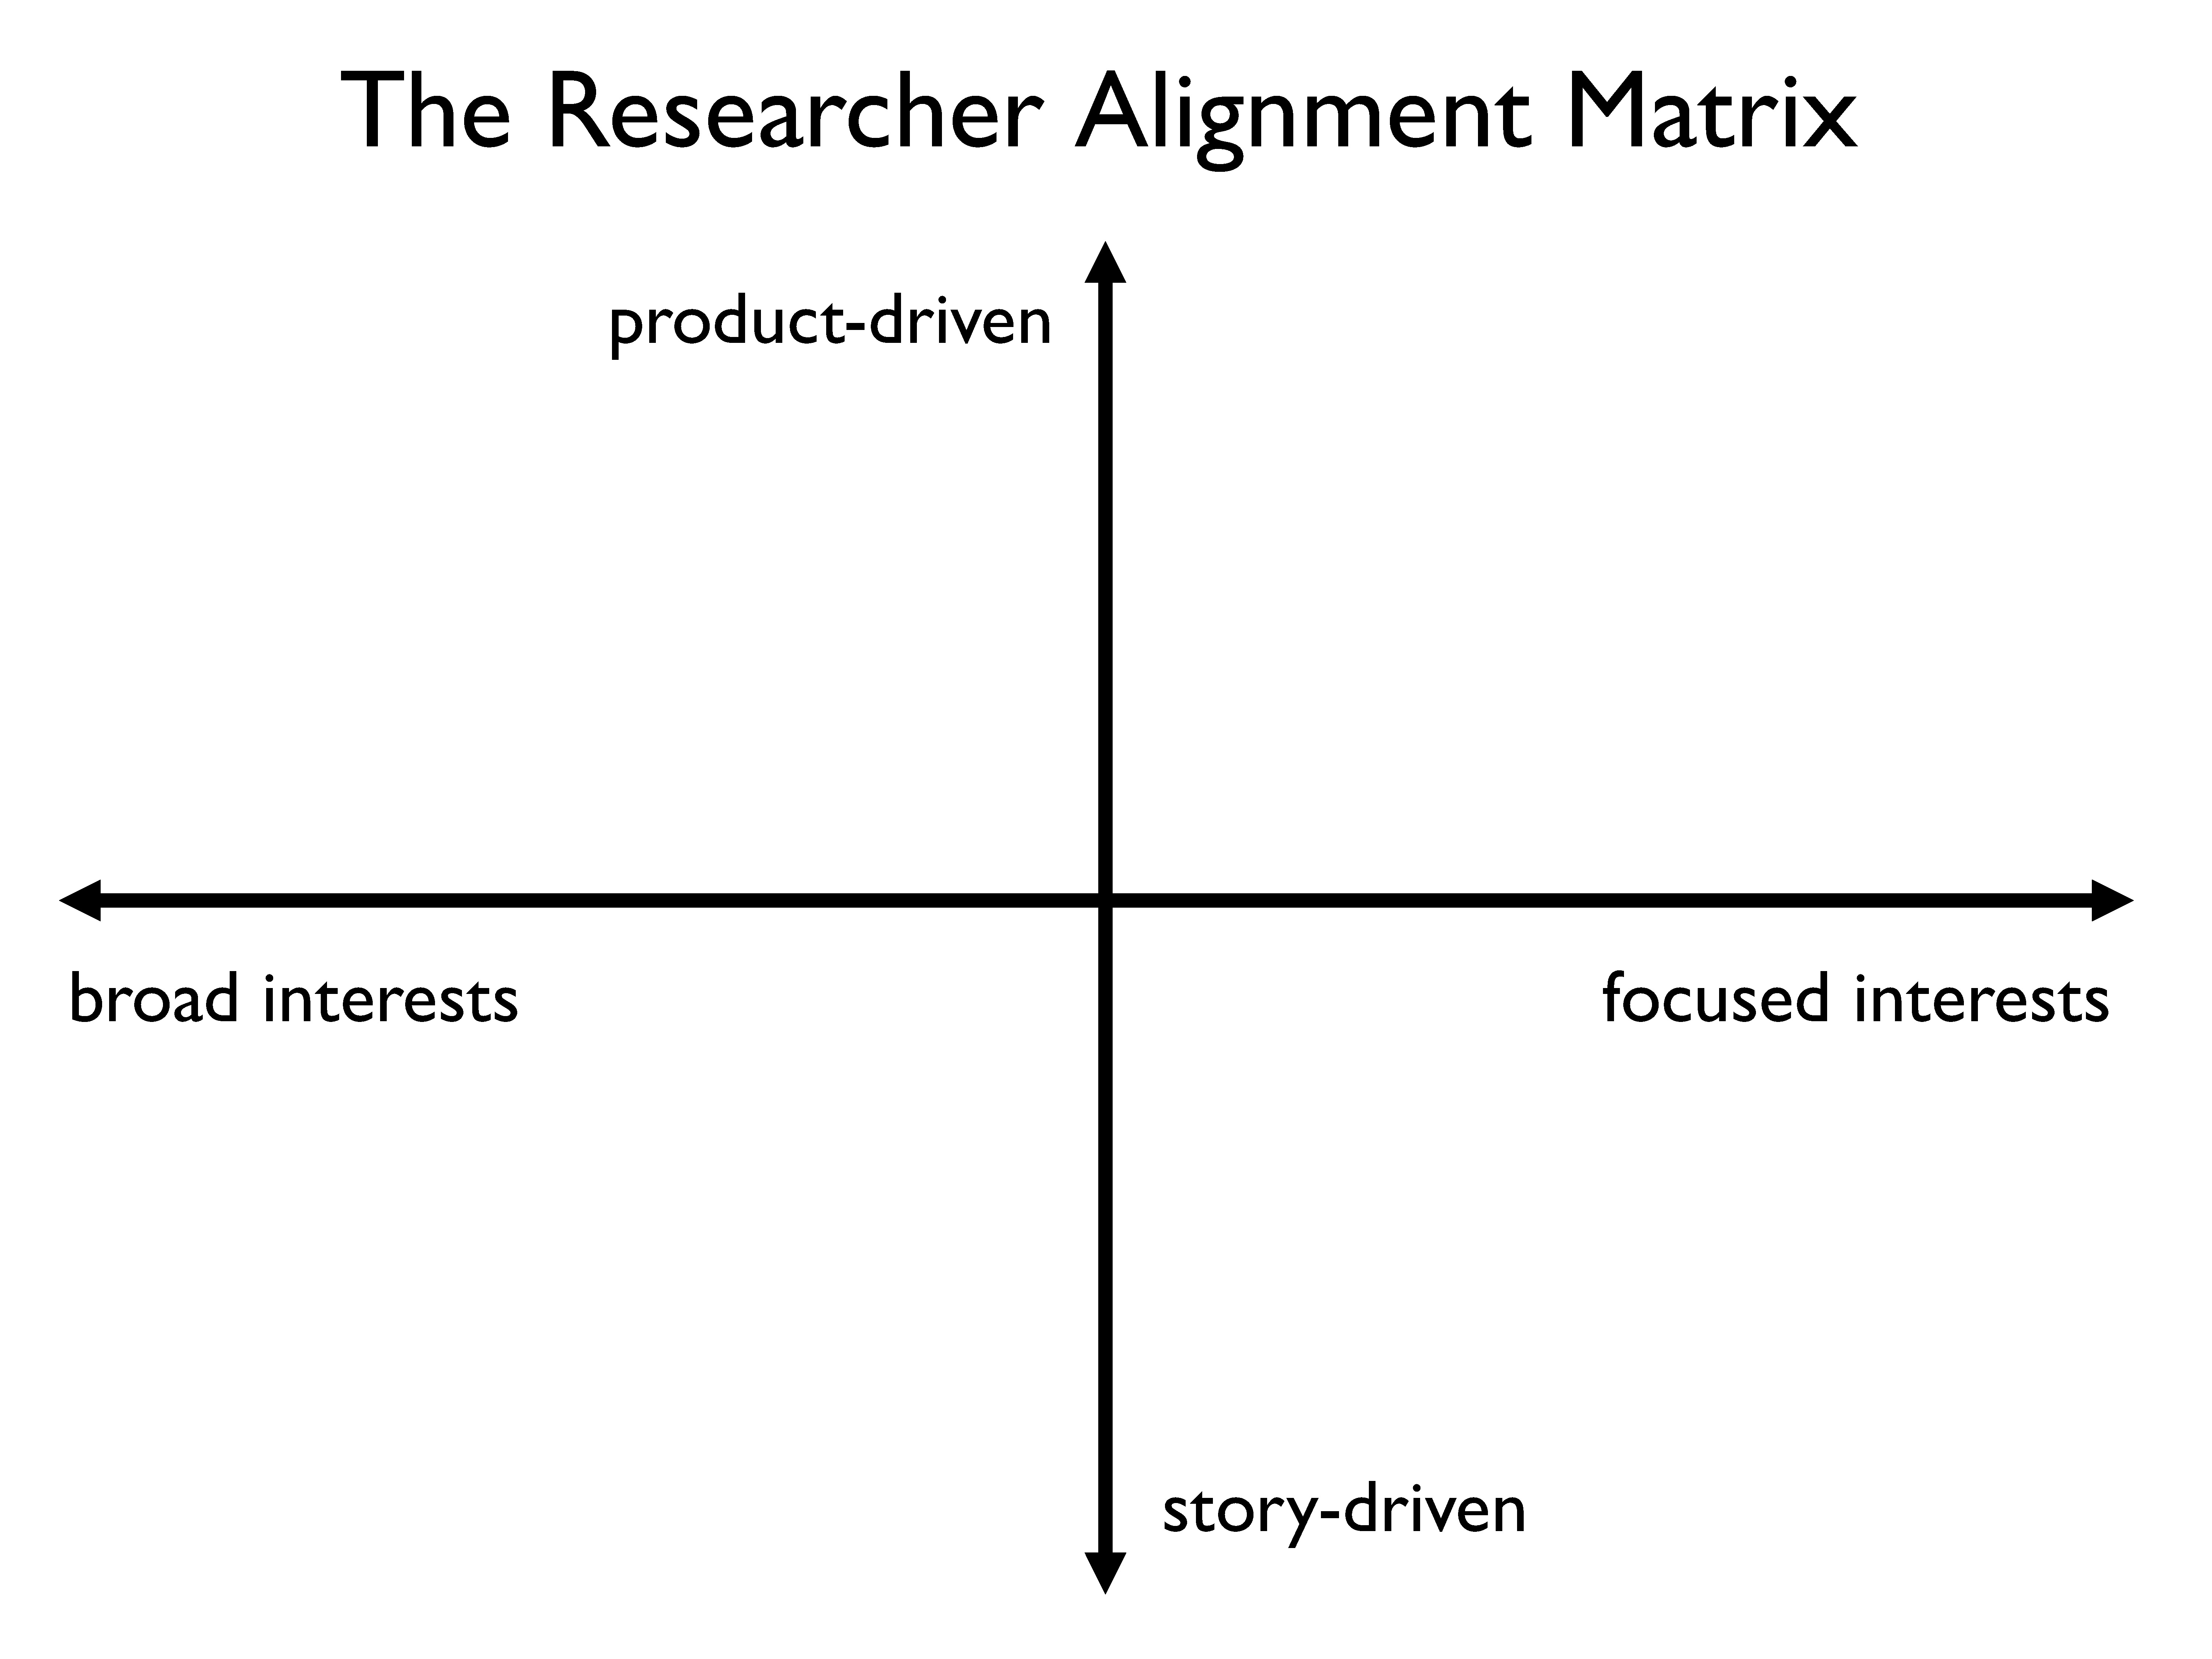
The vertical axis represents a preference for what type of projects the given researcher likes to take on. Of course all research involves some element of creativity (or else it wouldn’t be research), and of course all research involves some amount of explanation and communication (that’s why we have research papers, journals, and conferences). However, a product-driven researcher’s primary drive is to create new things, whether that is a new technique, a new process, a new tool, or any other new “things” that can directly be used by others, whereas a story-driven researcher’s natural impulse is to gravitate towards trying to get to the bottom of unanswered questions and explain how or why things are.1
Researchers who are primarily driven to create things tend to frame their research in terms of “contributions”, whereas those who are primarily driven to explain tend to frame their research in terms of “questions”. Another way to think about it is that product-driven research comes from “what-if” questions, whereas story-driven research comes from “how” or “why” questions. I also think story-driven researchers also tend to be a lot more process-driven, whereas product-driven researchers might have a bit more of a “move fast and break things” ethos.
The horizontal axis represents the breadth of the researcher’s academic interests. While contemporary academic culture forces researchers to pretend to be grounded in a single field, and many professional researchers are publicly primarily associated with a singular discipline, some people are definitely more prone to being distracted by other fields multidisciplinary than others. A researcher with very focused interests is likely to have a specific research agenda (that is, a specific set of research questions or goals) that they devote most of their professional life to trying to advance. A researcher with broad interests may not feel tied to a specific research agenda, may frequently change their research agenda, or may nominally have a primary research agenda that they regularly take side quests away from.
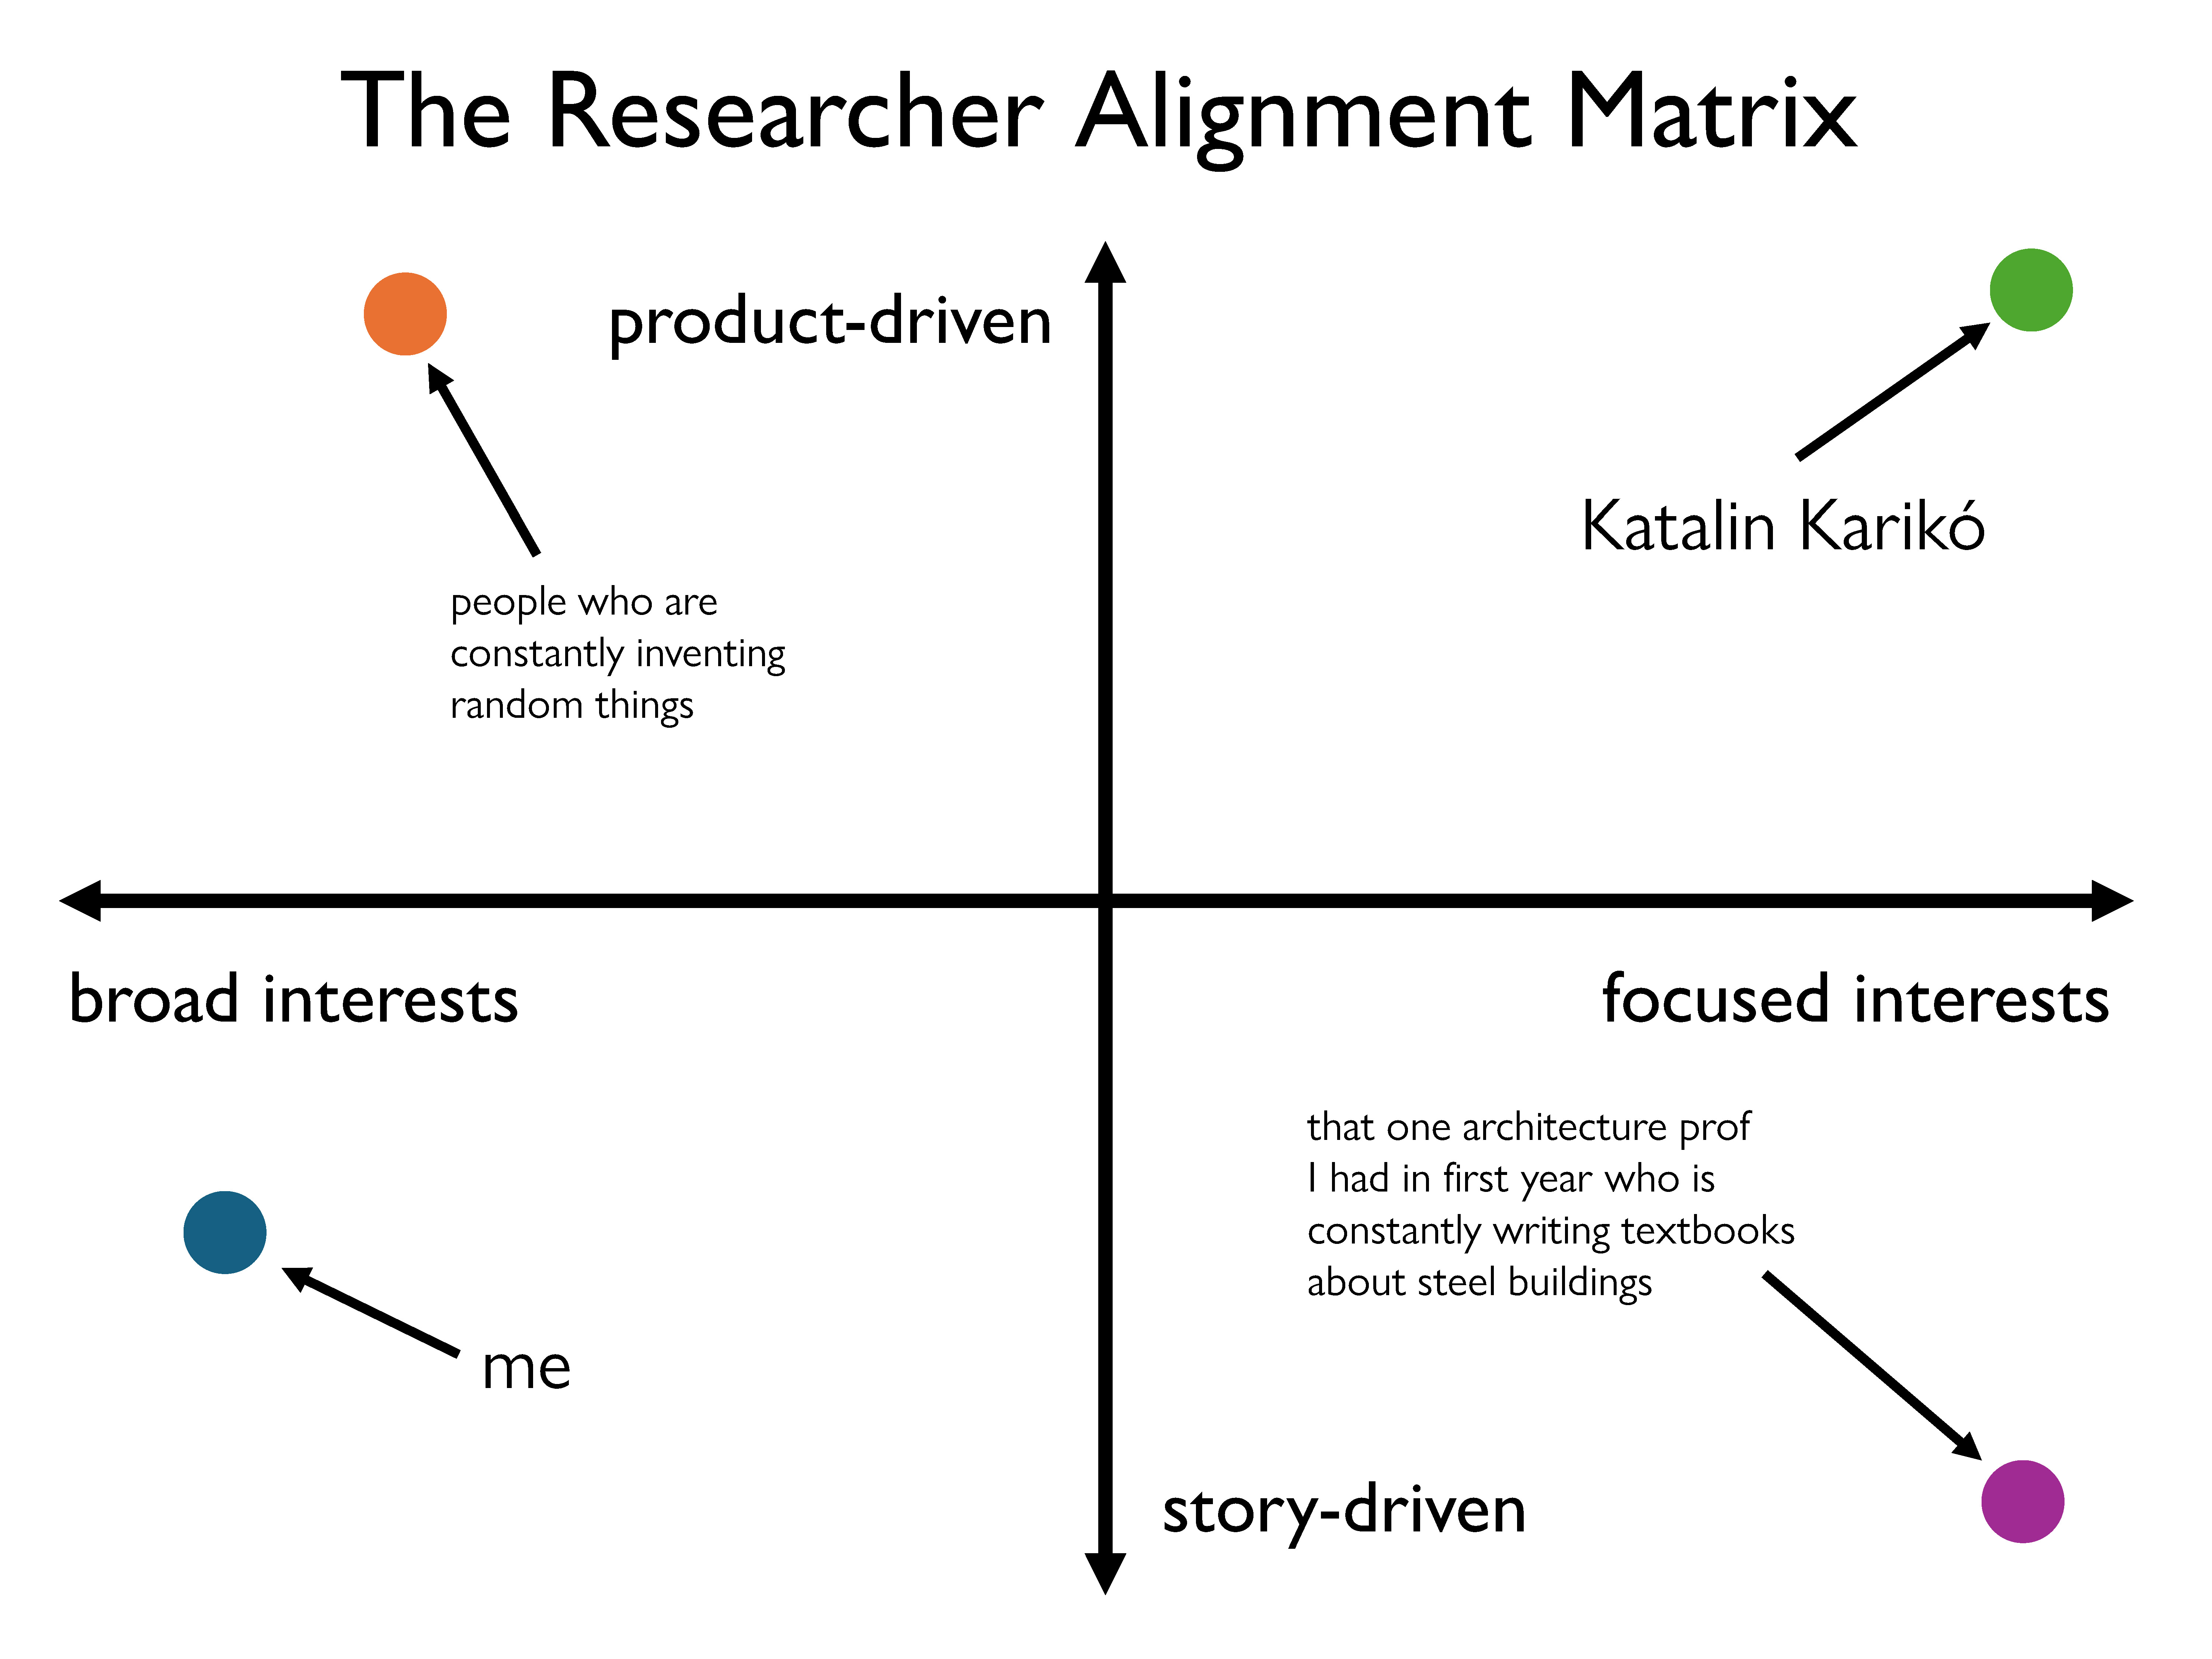
For concreteness, I’ve added some different points to this chart. People who are constantly inventing random things are likely to be very product-driven researchers with broad interests, although they tend to also have a lot of depth in one or a few areas. Their breadth of knowledge and exposure to different ideas tends to help them combine concepts in interesting ways that lead to creating new things.
Katalin Karikó was recently awarded the Nobel Prize in Medicine for her joint work with Drew Weissman that enabled the creation of the COVID-19 vaccine. I put her in the top right-hand corner (product-driven with focused interests) because she has literally devoted her entire life to working on mRNA and vaccines. I can’t stay focused for that long; I suspect I’m going to end up changing focus every few years.
In the bottom-right corner (story-driven with focused interests), I’ve put an architecture prof I had in first year who keeps writing books about steel building construction. She doesn’t actually design steel buildings at an architecture firm, she just keeps writing books about them. She also sits on a variety of councils and committees related to tall buildings. If that isn’t dedication to producing explanations related to her very focused interest, I don’t know what is.2
I find that I personally sit somewhere in the bottom left corner of this chart. While my research is supposedly focused on internet security these days, I probably spend just as much time reading and thinking about education and organizational dynamics. My strengths are in synthesis and analysis, and not so much in the kind of inventive poking around that leads to creating new things. I’m prone to theorizing and for trying to come up with frameworks for things. Given that I’m a writer first, this shouldn’t be too surprising.
I came up with this chart as a result of trying to mentally group the intellectual tendencies of different researchers and seeing where they aligned with and differed from my own.3 I think it’s helpful because it’s a quick mental model for what kind of problems you might run into when trying to collaborate with someone. It’s probably especially helpful if you’re a student trying to figure out if you’ll be intellectually compatible with a professor. For example, if you’re product-driven, and your supervisor is story-driven (or vice versa), you might not have a very good time because you might end up clashing over what type of research you should be doing and how you should go about doing it. However, if you are collaborating with someone who is more or less an equal, that pairing might work, because you can each take on the part of the project that plays to your strengths.
-
You might be thinking something along the lines of wait a sec, I’ve heard that before. Isn’t this another version of the “theory-builders vs problem solvers” divide? And the answer to that question is no. I think those labels are stupid, and additionally, that they’re fundamentally wrong. What you have to remember is that the “theory-builders” vs “problem-solvers” dichotomy was basically invented by pure mathematicians, and that in fields other than mathematics, sometimes the theory is the “product” and the concrete problem-solving (gathering data, etc.) is the “story”. ↩︎
-
Her name is Terri Boake, in case you were wondering. She’s an amazing professor, but boy, is she a character. She somehow managed to turn what was supposed to be a course on architectural history into a course on building science and the history of construction materials. ↩︎
-
One thing I’ll note is that this should really be a 3D chart, with a third axis for how motivated by money and prestige the researcher is, but I think that’s too big a can of worms for this article. This matrix mainly aims to explain intellectual alignment, and in no way claims to be a completely predictive framework. ↩︎