Why Does Theory Matter in Computer Science? /
Why Does Theory Matter in Computer Science? (Part 2)
Real-World Problems and a Crash Course to Graph Theory
This is the second installment in the written version of my talk about why I think theory matters in computer science. You can find part 1 here, part 3 here, part 4 here, and a list of references here. The entire series is archived here.
Some interesting “real-world” problems
In the first part of this talk, I made the case that theory is useful because it allows us to find (or at the very least, have the correct toolkit and language to explore) solutions to real-world problems. In this part, we are going to look at some examples of such problems and develop mathematical language to be able to discuss them more abstractly.
I’ve put the term “real-world” in quotes in the title, because I’m going to be talking about these problems in a lot of generality. However, I want to stress that specific instances of these problems are actually relevant in industry, and I think it’ll be easy to see why once I start talking about them.
I also want to want to point out that by giving general definitions of problems with a lot of details left out for clarity, we are already taking a first step onto the ladder of abstraction.
Community detection
The first problem we’re going to look at is what we call “community detection”, applied to the internet in this case. The idea is that we’re trying to group websites and pages into categories without actually reading every web page, because that would be impossible. So, how else can we detect groups of web pages that are related to each other? And how can we find the most “authoritative” or “important” web pages in each group?
This problem is a little bit less relevant now than it used to be, because the distribution of information on the internet has changed drastically over the years. The first papers about community detection were written in the 90s, when the Internet was still a collection of individual web pages, with links between them. At the time, most people on the internet maintained their own websites and primarily published content on their own sites. Nowadays, most of the Internet seems to exist on a very small group of social media platforms, which is where most content is being circulated. (See the idea of the internet consisting of five websites, each consisting of the other four. Tom Eastman said it first; Cory Doctorow popularized it.)
That being said, there are still billions of pages on the internet. If you’re a search engine, like Google, or an advertiser, like Google, this problem is probably relevant to you. (Though, if you’re as big as Google, you’re likely solving it using much more sophisticated techniques than what we’ll see here.)
Topic clustering
The next problem is topic clustering. Let’s say you’re a content platform, like YouTube, and there’s all this user generated content flooding your platform. How do you figure out which groups of content are similar or related enough to appeal to similar groups of people? Also, how do you figure out which groups of content are the most likely to be popular?
This problem is also known as large near-clique extraction, which is terminology that comes from graph theory. I’ll explain this a little bit more later on.
Correlation mining
Let’s say you’re an investment firm, and you’re trying to predict trends in the market so that you can make money for your clients. There are all sorts of assets you could be investing in or betting against, and many of them are interlinked with other assets. You may want to figure out which groups of assets are the most influential in the market. So how are the assets grouped? How do the groups relate to each other? Which groups of assets have the most influence on other groups?
These sorts of questions are an example of something called correlation mining – finding and analyzing relationships (“correlations”) between objects to determine which objects are the “most important.”
There are analogs of this question in genetics (for example, when trying to determine which genes will be expressed), in neuroscience, in spam detection, and so on.
How do we solve these problems?
I hope I’ve managed to convince you that these problems are important, or, at a minimum, that at least some of them are worth spending time to think about. At this point, the question becomes, how do we solve these problems?
It is also important that we figure out a way to solve these problems efficiently, that is, within a reasonable amount of time. YouTube can’t afford to wait around for an algorithm that takes years (or some other ridiculous amount of time) to finish running, because YouTube is out here trying to make money! Inefficient algorithms aren’t great in most real-world contexts because they take forever to terminate (if ever) and bleed money and resources.
If you’ve been looking closely, you may have noticed that these all kind of sound like the same problem. Or at the very least, they all sound like similar problems. In fact, if we abstract away some details, these can all be considered instances of the densest subgraph problem.
Graph theory: a crash course
Before I can talk about the densest subgraph problem (or DSP for short), I have to give you a crash course on graph theory. The language of graph theory is the abstraction that will allow us to describe a generalized solution for the previous problems we just looked at. In fact, graphs are so useful as a tool for representing problems in computer science that they’re impossible to avoid in a CS degree.
If you’ve already been introduced to graph theory, feel free to skip this section.
A graph is a way of representing pairwise relationships between objects.
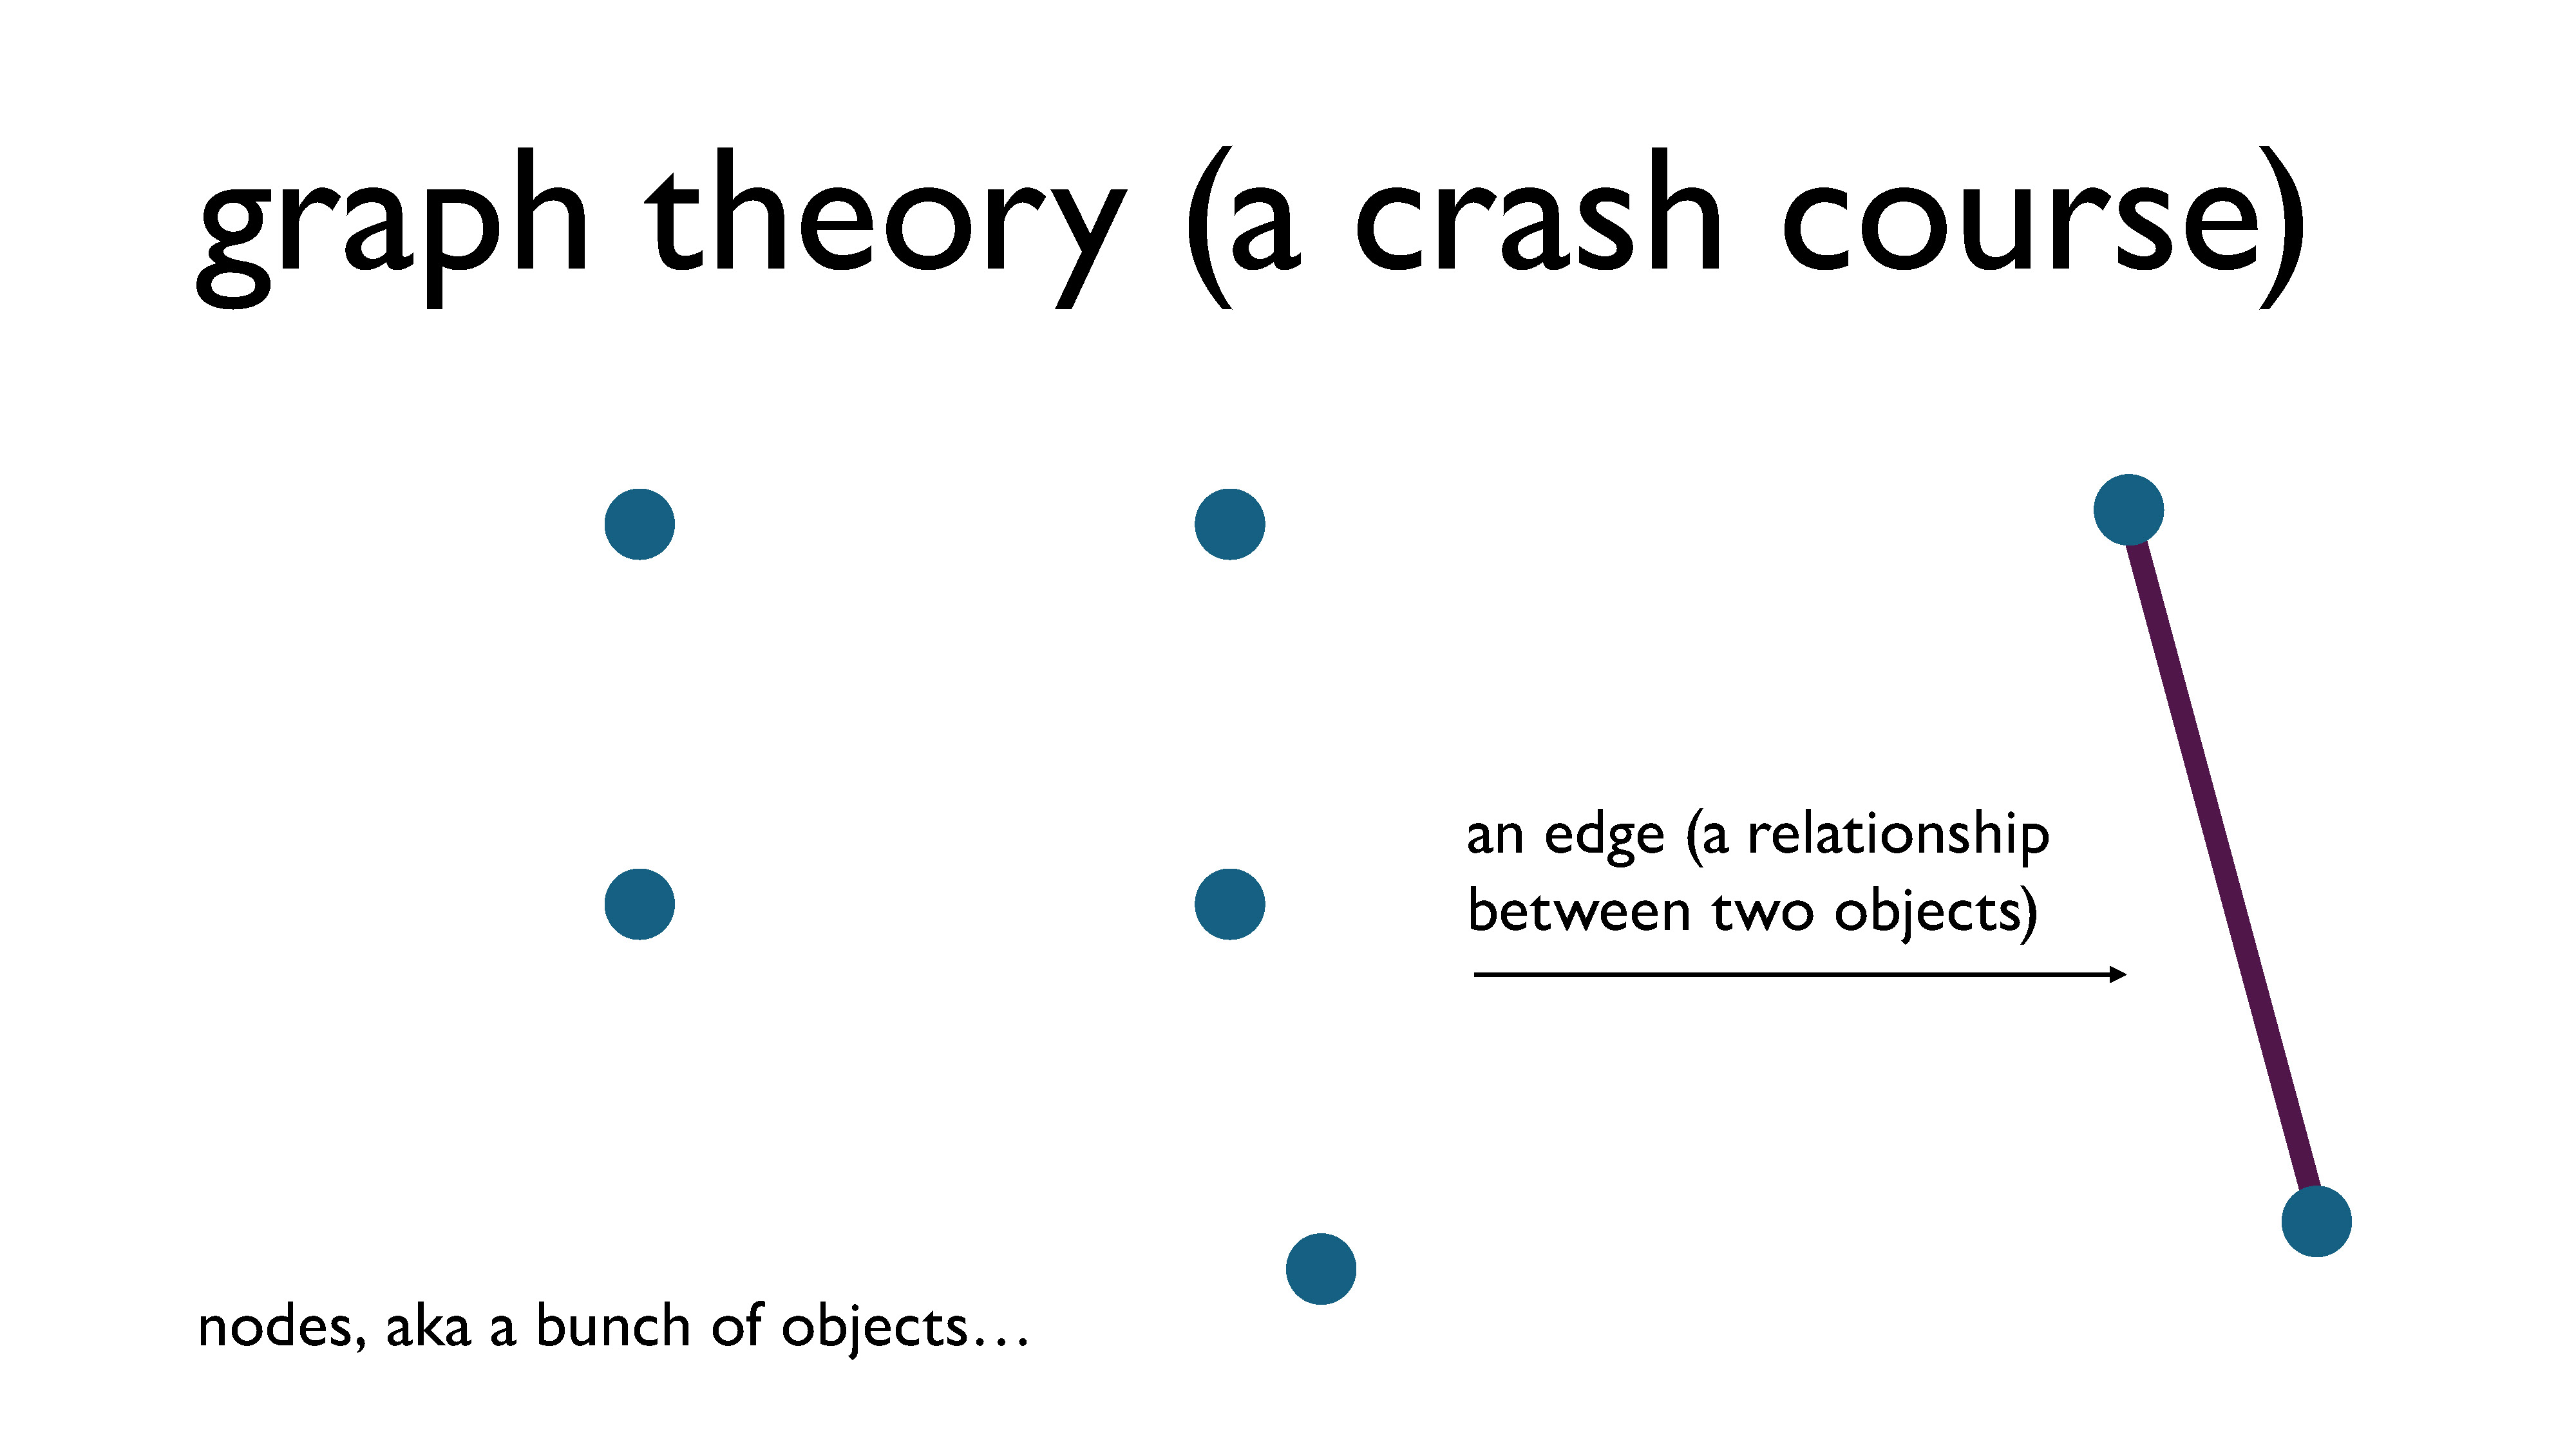
We represent the objects using what we call vertices (also called nodes) and we put an edge between two vertices if the objects are related. (I tend to use the word “node” when talking abstractly about the objects and the word “vertex” when discussing a drawing of a graph – that’s just a habit that I have – but they’re pretty much interchangeable words and they are used interchangeably.)
A pairwise relationship we often use as an example in graph theory is friendship: our objects are people, and we put an edge between two people if they’re friends. This, for example, is how relationships are described on Facebook.
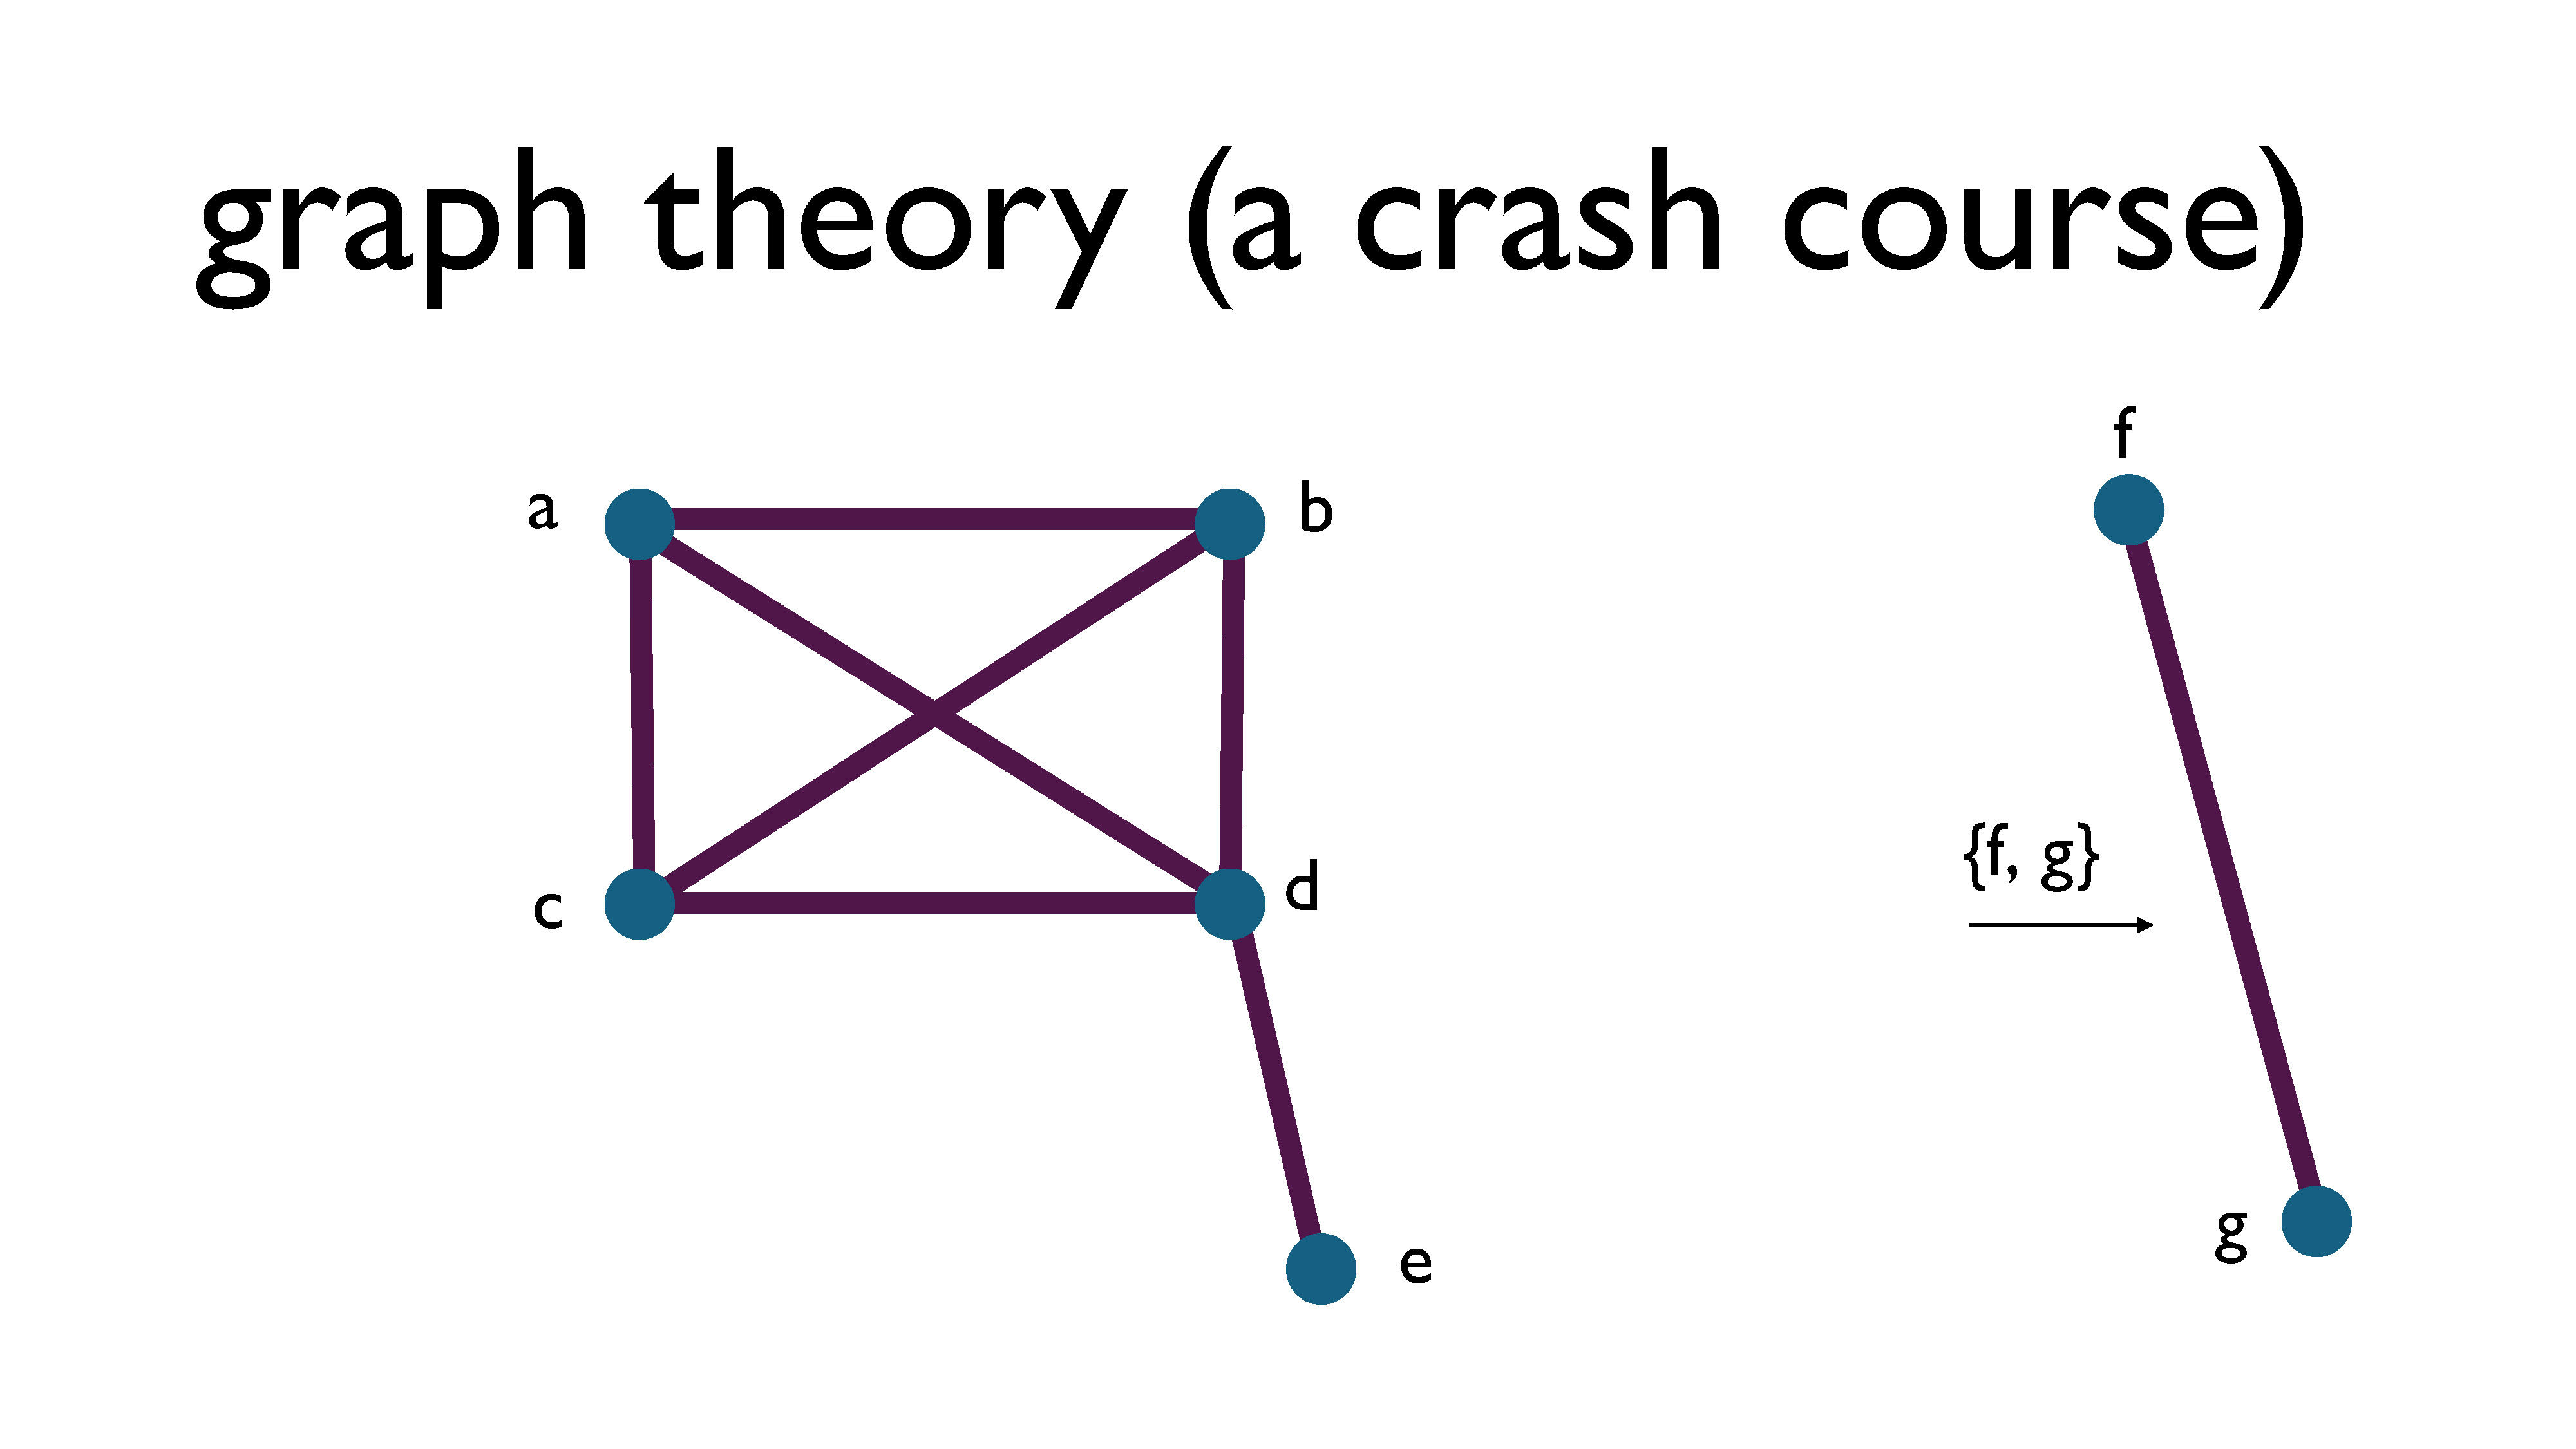
Here’s a graph that’s a little bit more interesting than the previous graph. Notice how I’ve labelled the vertices – we often do this to make talking about the graph a little bit easier.
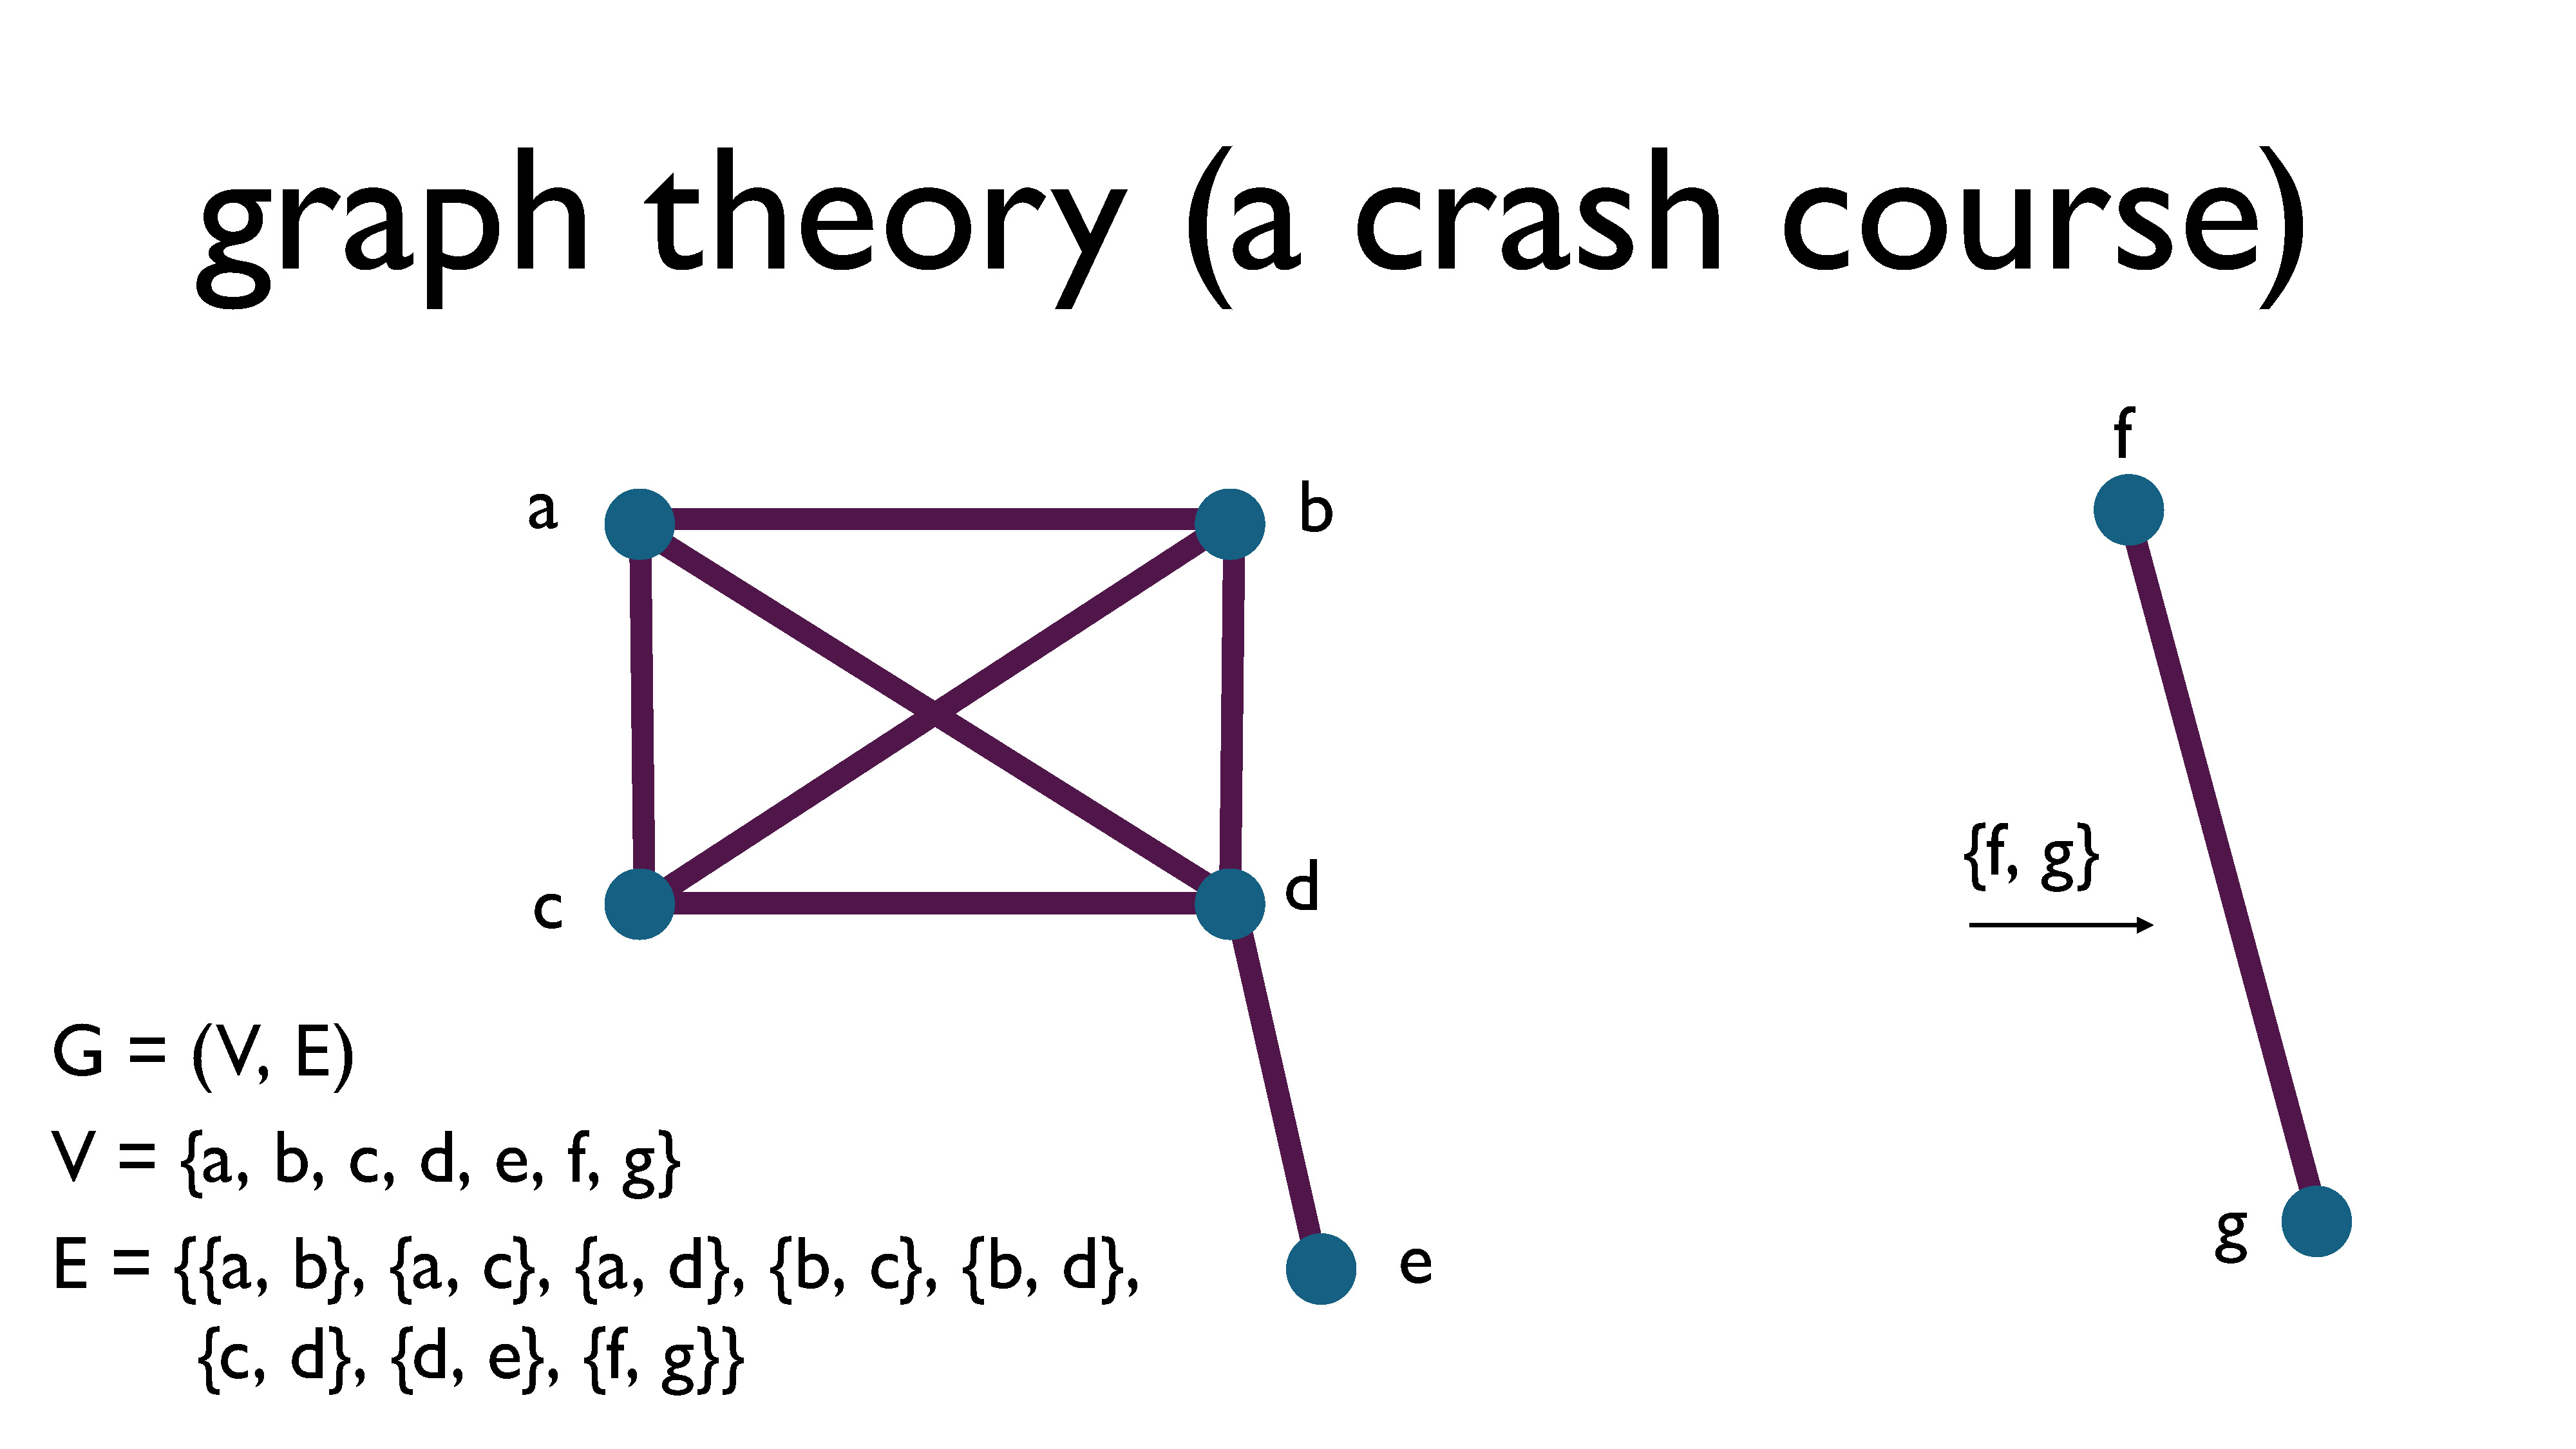
Formally, a graph, denoted $G$, is defined as a pair consisting of a set of vertices $V$ and a set of edges $E$, where each edge is a two-element subset of the vertices. For example, in the picture above, the edge between f and g is represented by the subset $\{f, g \}$. This is called an undirected graph.
(You can also look into hypergraphs, which are generalizations of graphs. I previously wrote a primer on hypergraph theory, which you can find here.)
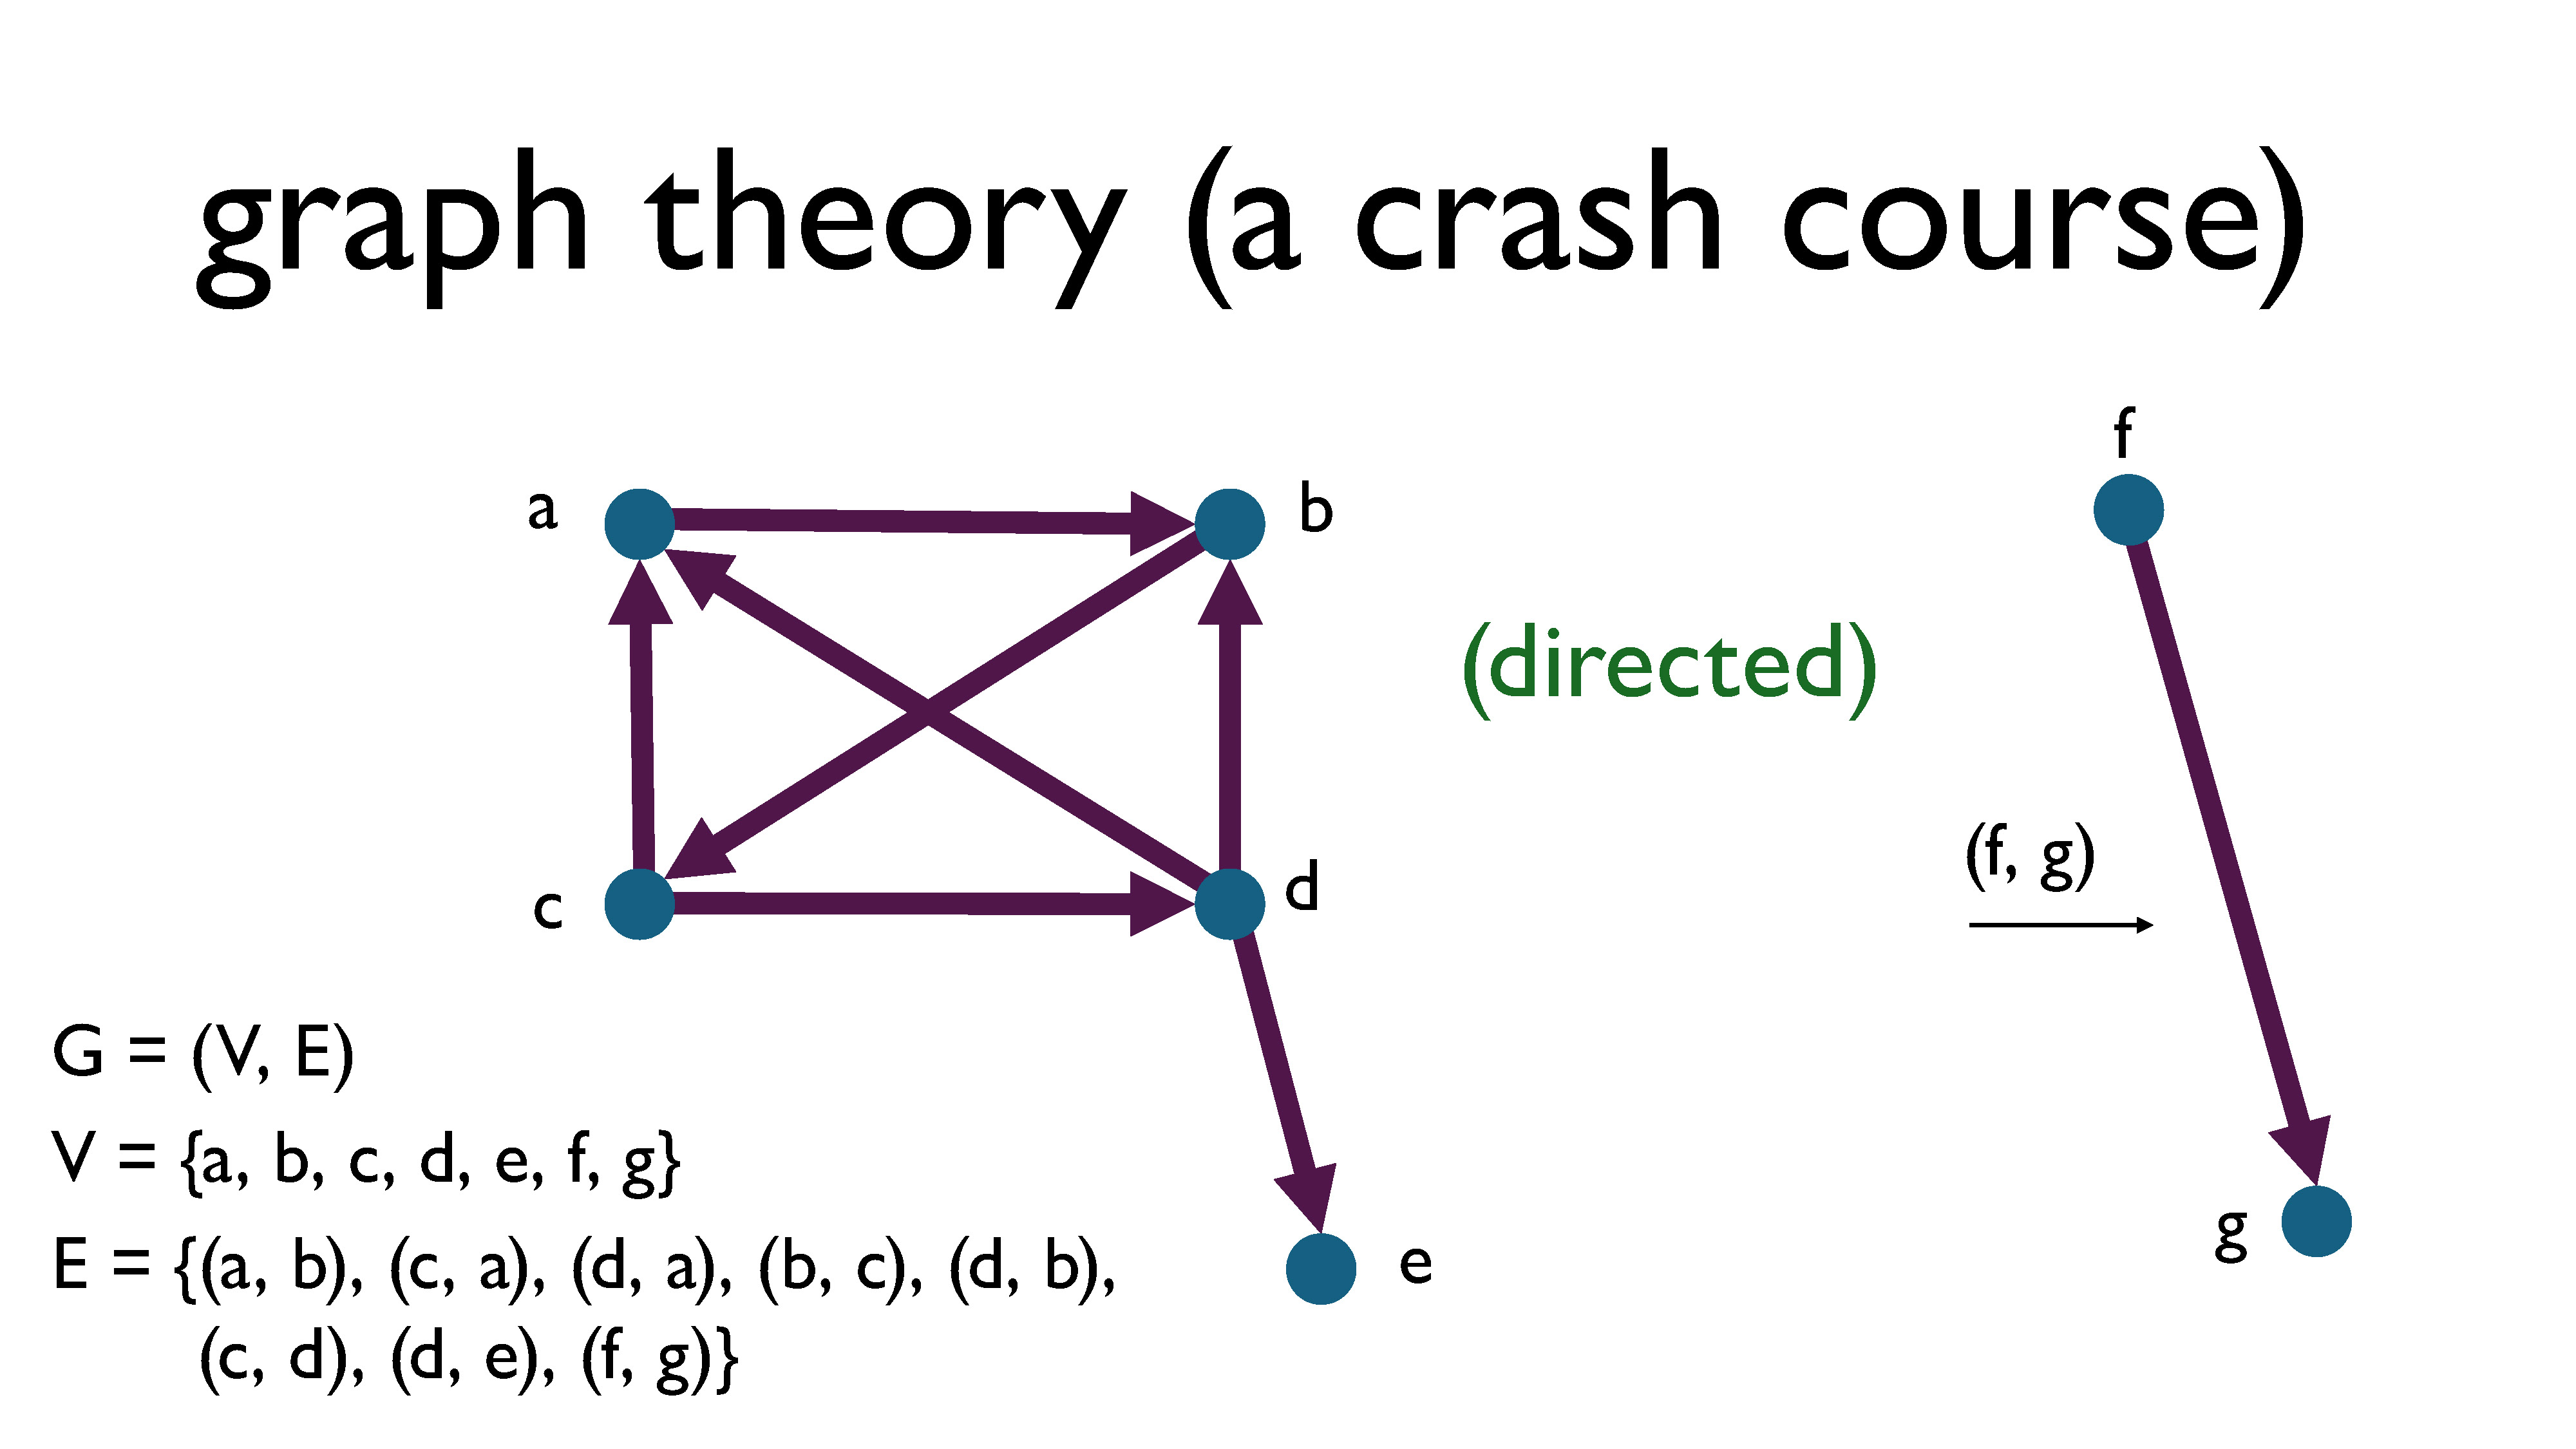
There are also directed graphs (sometimes called digraphs), where edges are ordered pairs, meaning that each relationship is one sided. For example, following someone on Twitter is a one-sided pairwise relationship: if I follow you on Twitter, that does not imply that you will follow me back. This is different from friendship on Facebook, where if I’m friends with you, that implies that you are also friends with me. An edge $(a, b)$ in a directed graph is represented by an arrow going from vertex $a$ to vertex $b,$ with the arrowhead pointing at $b$.
I only mentioned directed graphs for completeness, since we’re mostly going to ignore those in this presentation. Whenever the word graph is used without qualification, it’s generally understood to be referring to an undirected graph.
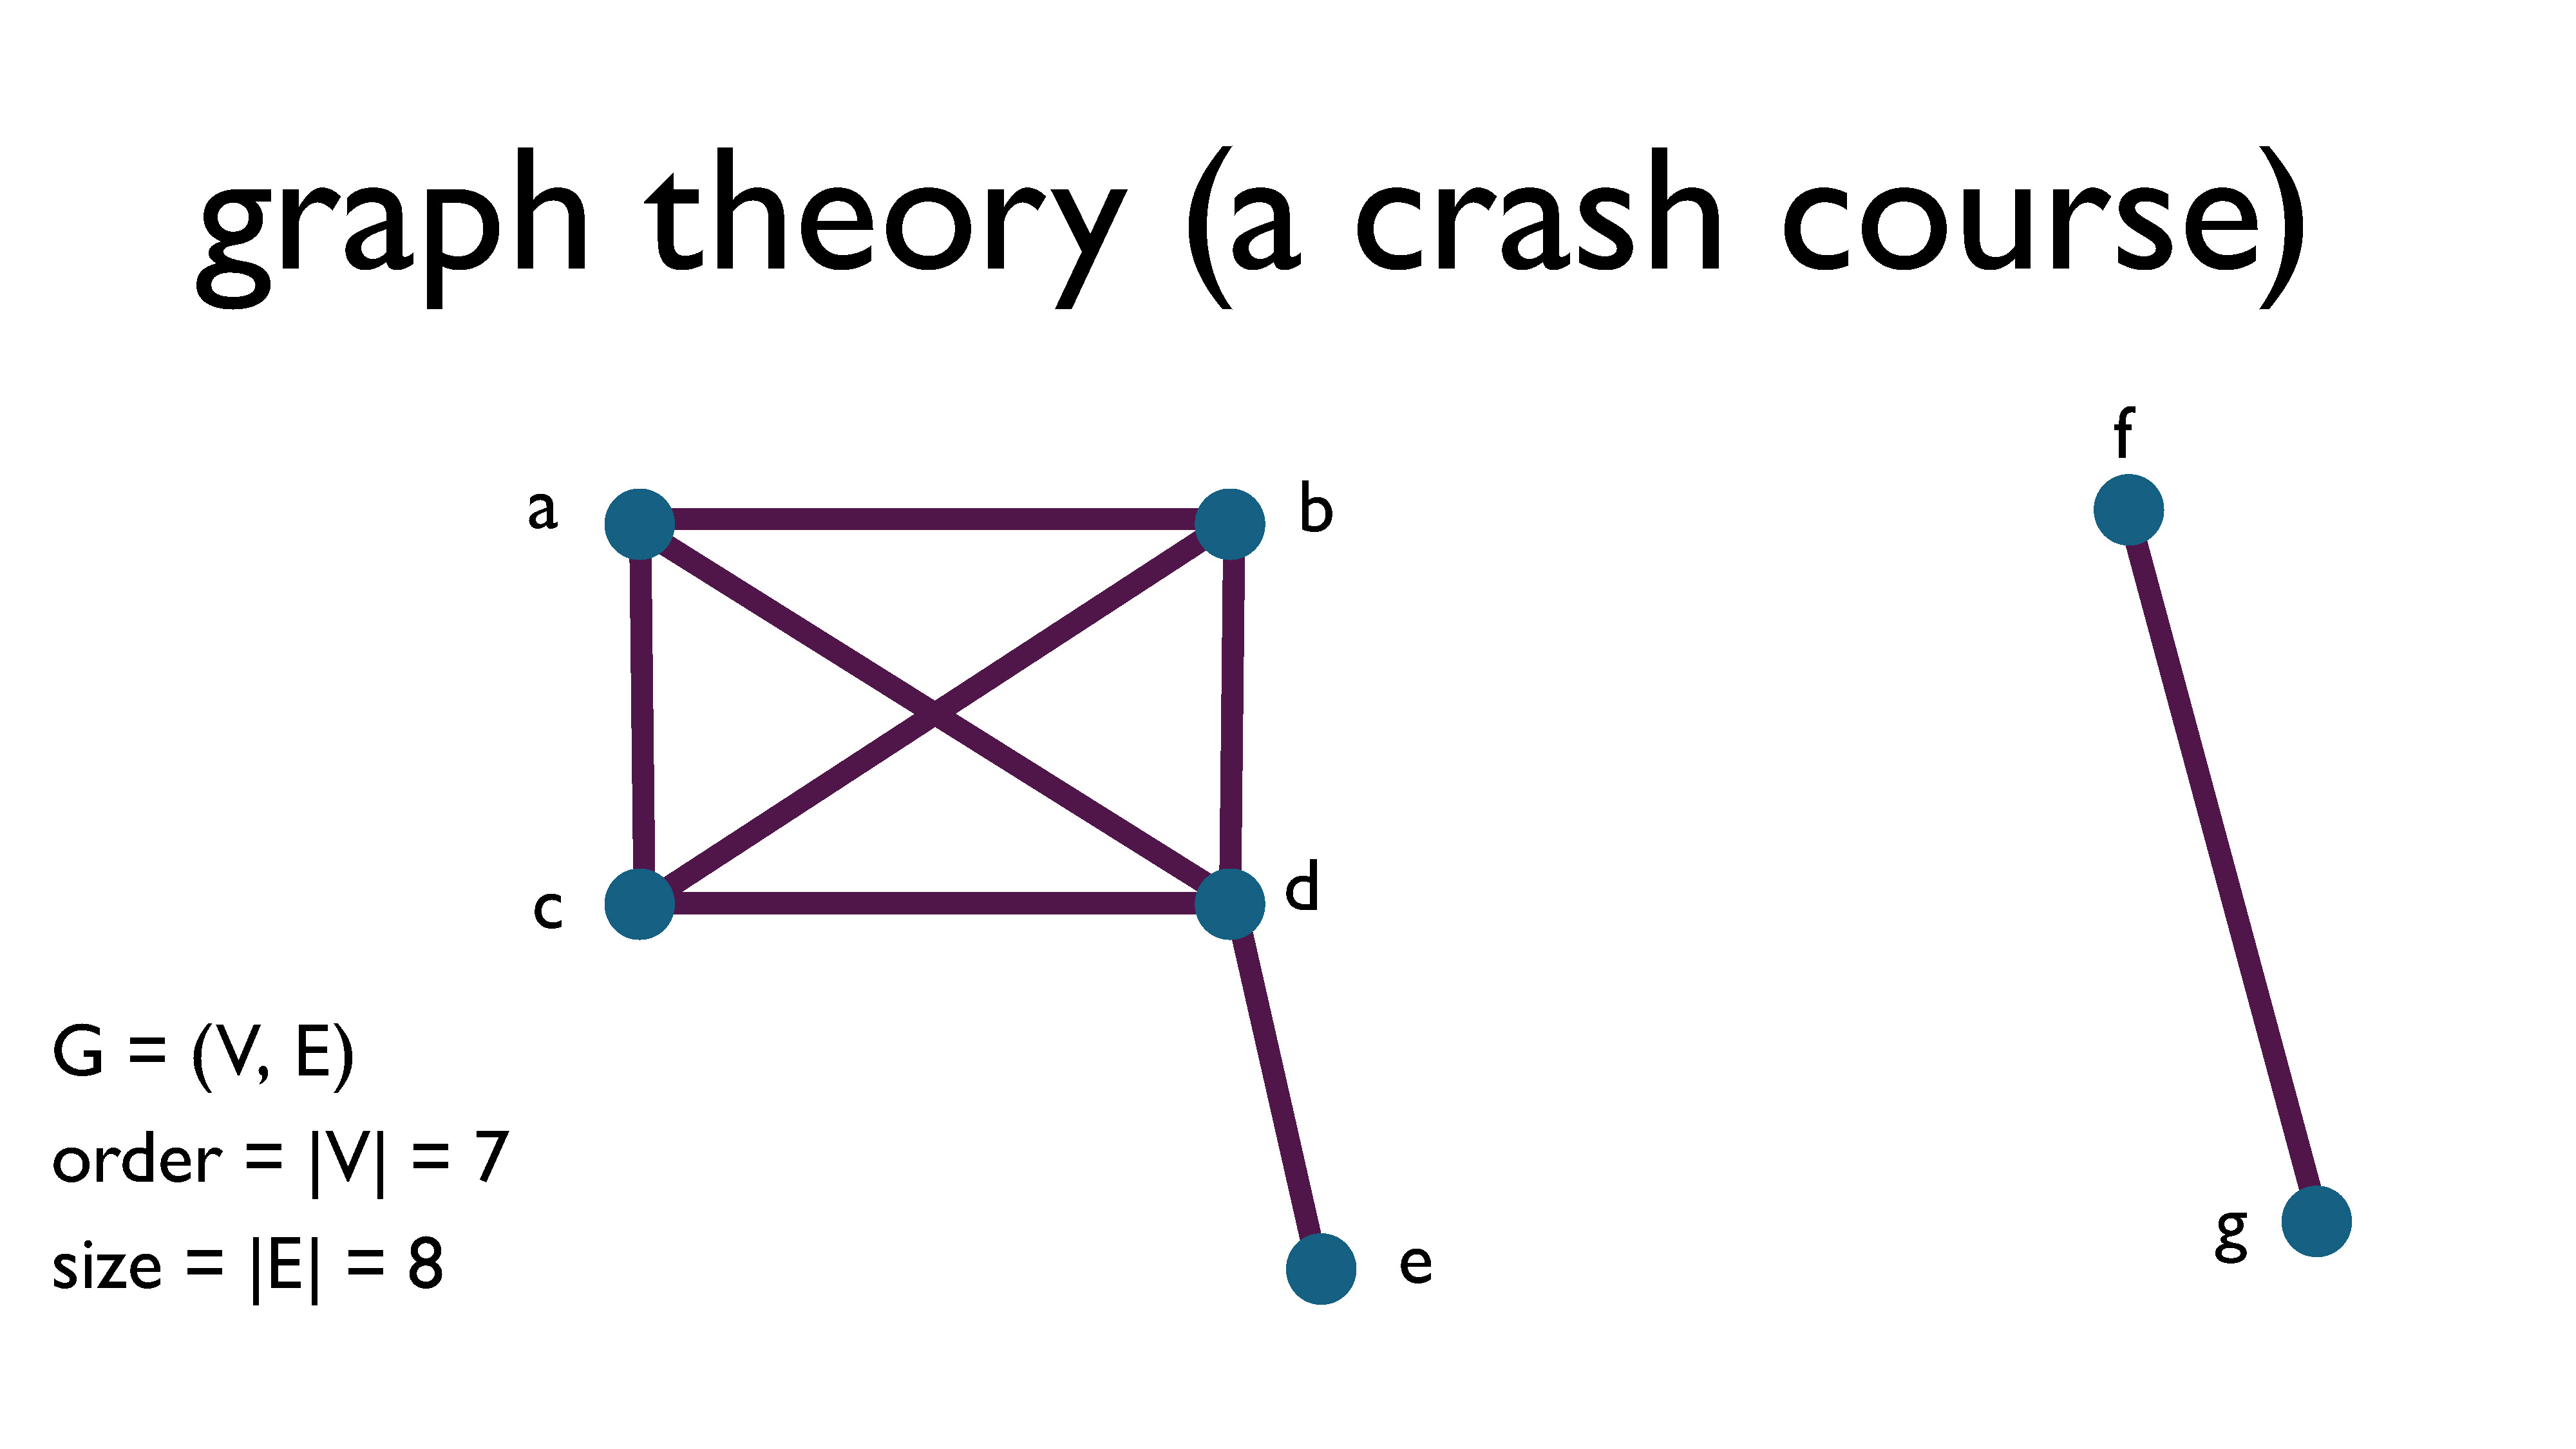
The order of a graph is the number of vertices in the graph, and the size of a graph is the number of edges it contains.
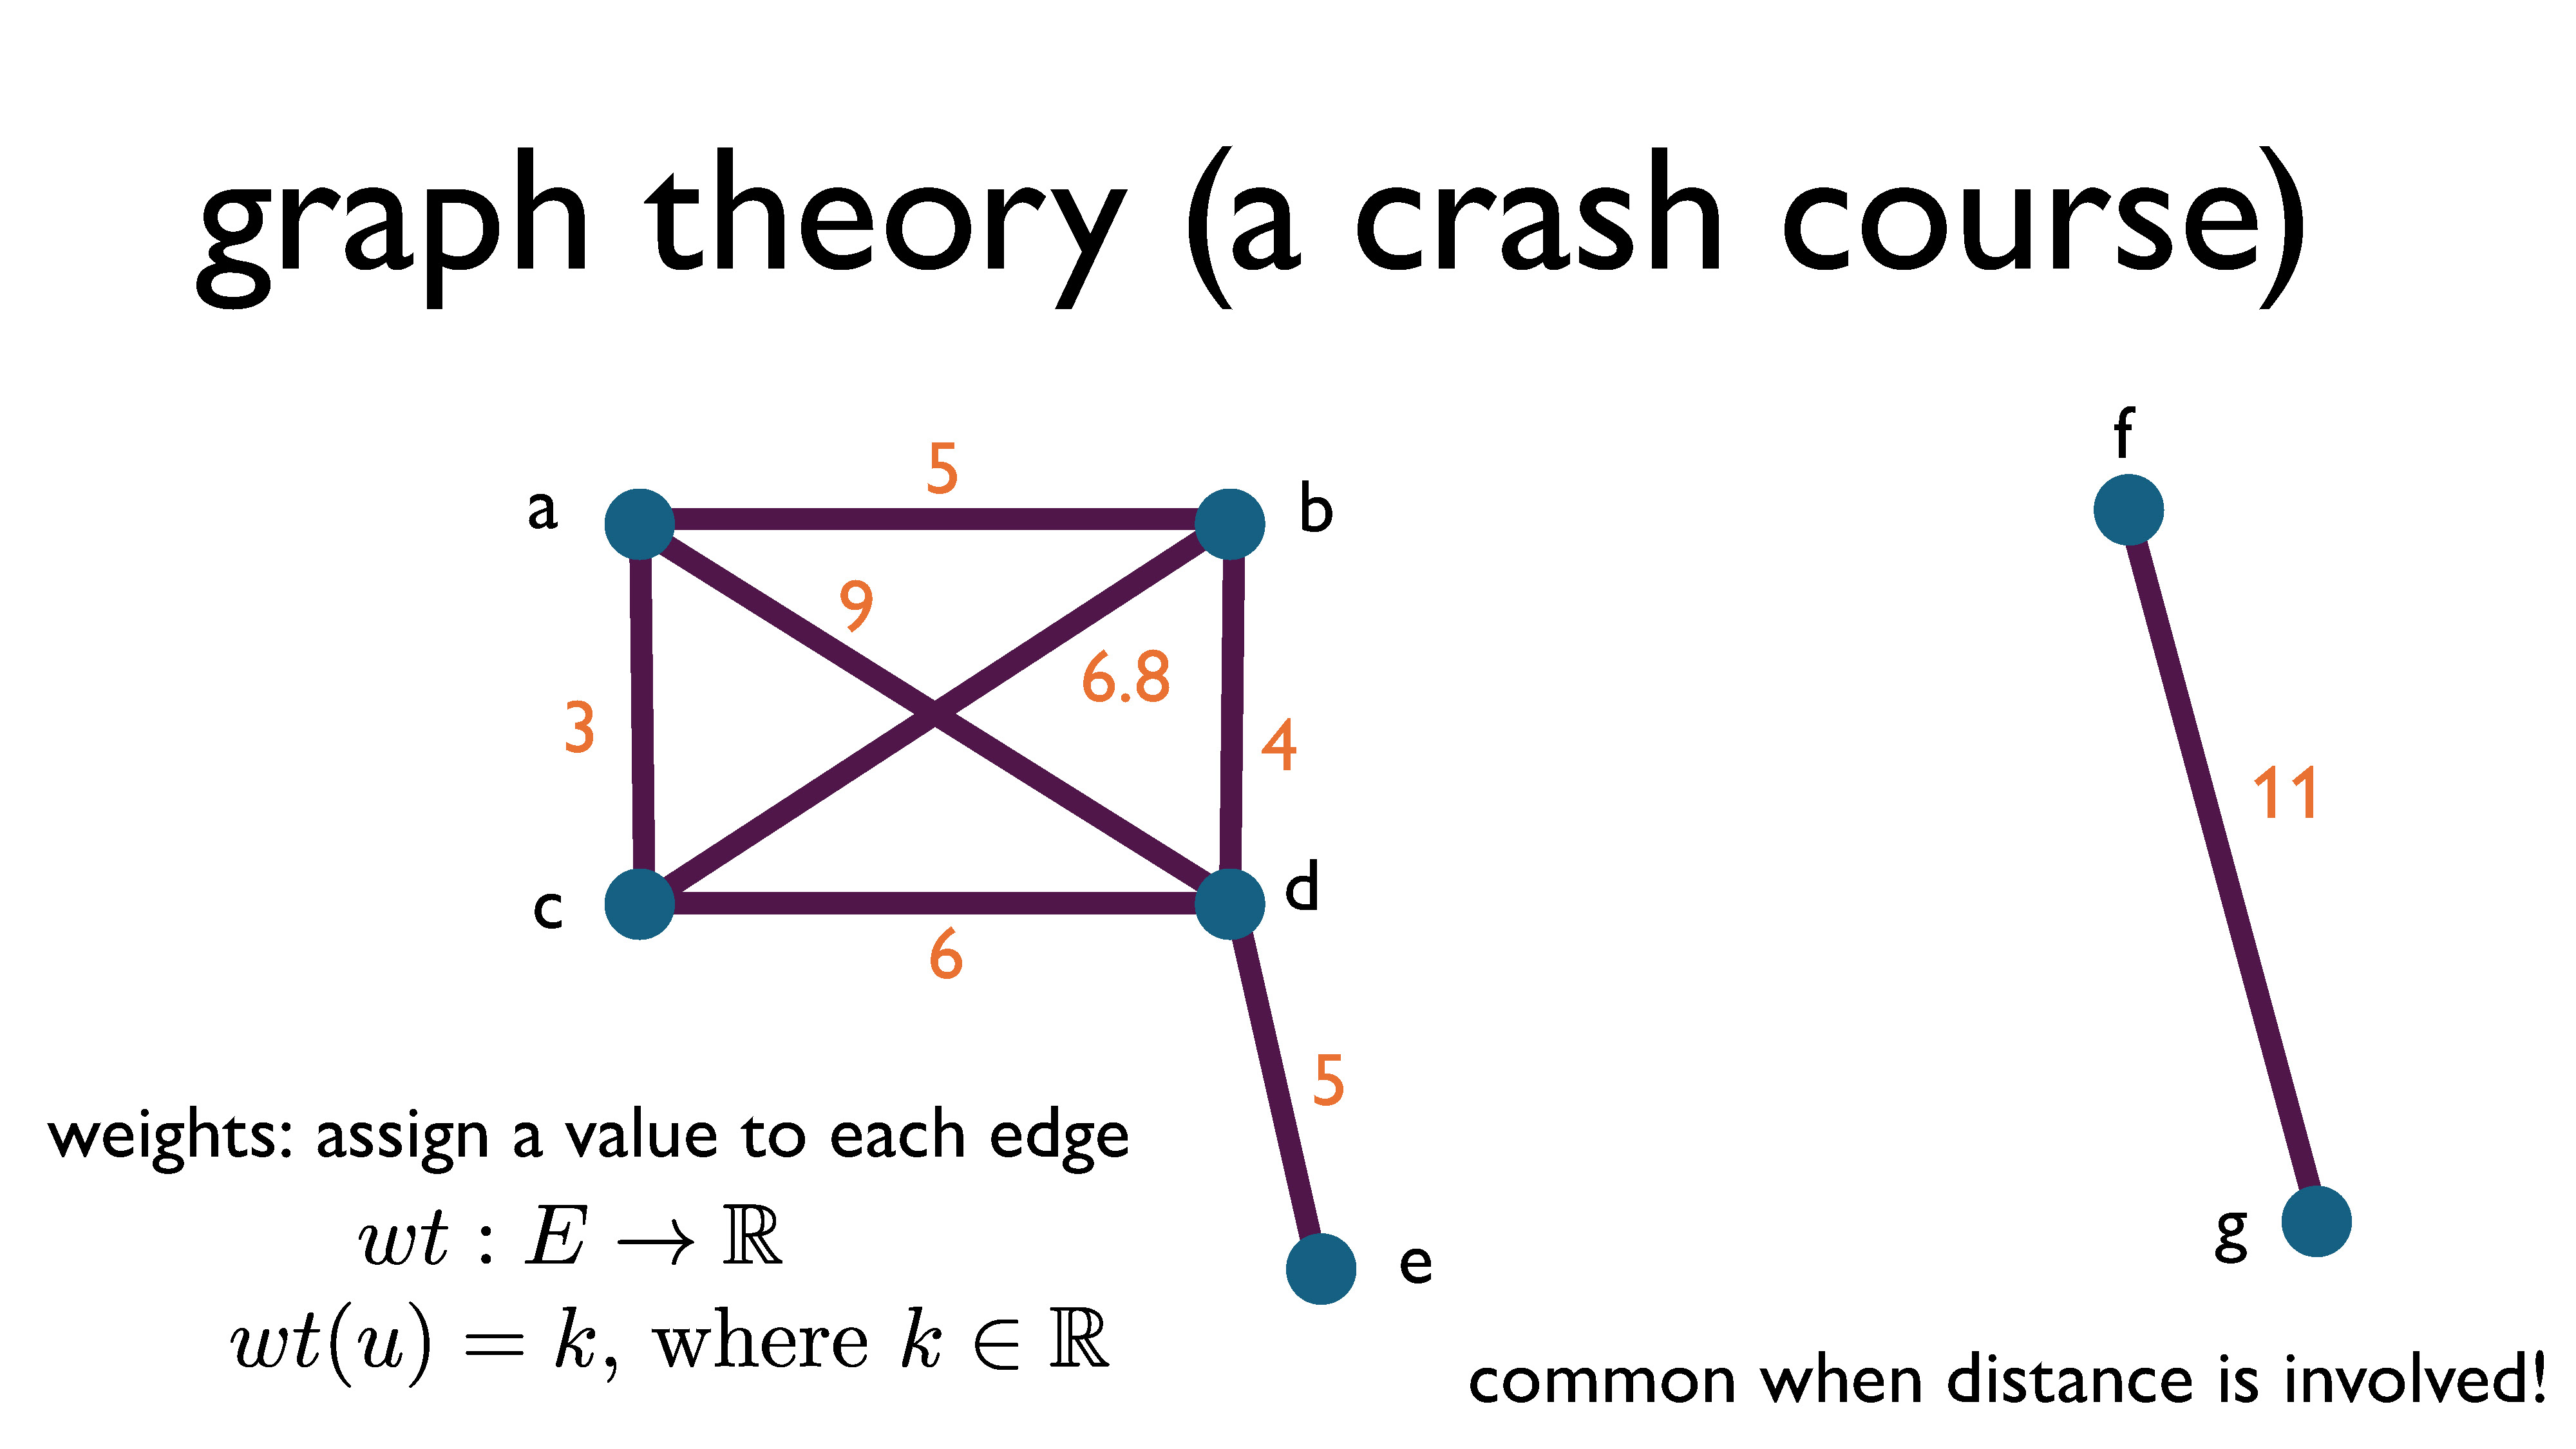
A graph can be weighted. This means that every edge is assigned a number, which typically has an actual meaning associated with it. This is really common when we’re talking about maps and geometry or space related problems. Then, nodes are locations, edges are roads, and weights are the distance between two locations. You can also have negative weights on a graph (but we’re not going to go there in this presentation).
Formally, a weighted graph is a graph $G = (V, E)$ together with a weight function $wt: E \rightarrow \mathbb{R}$ that maps every edge to a real number.
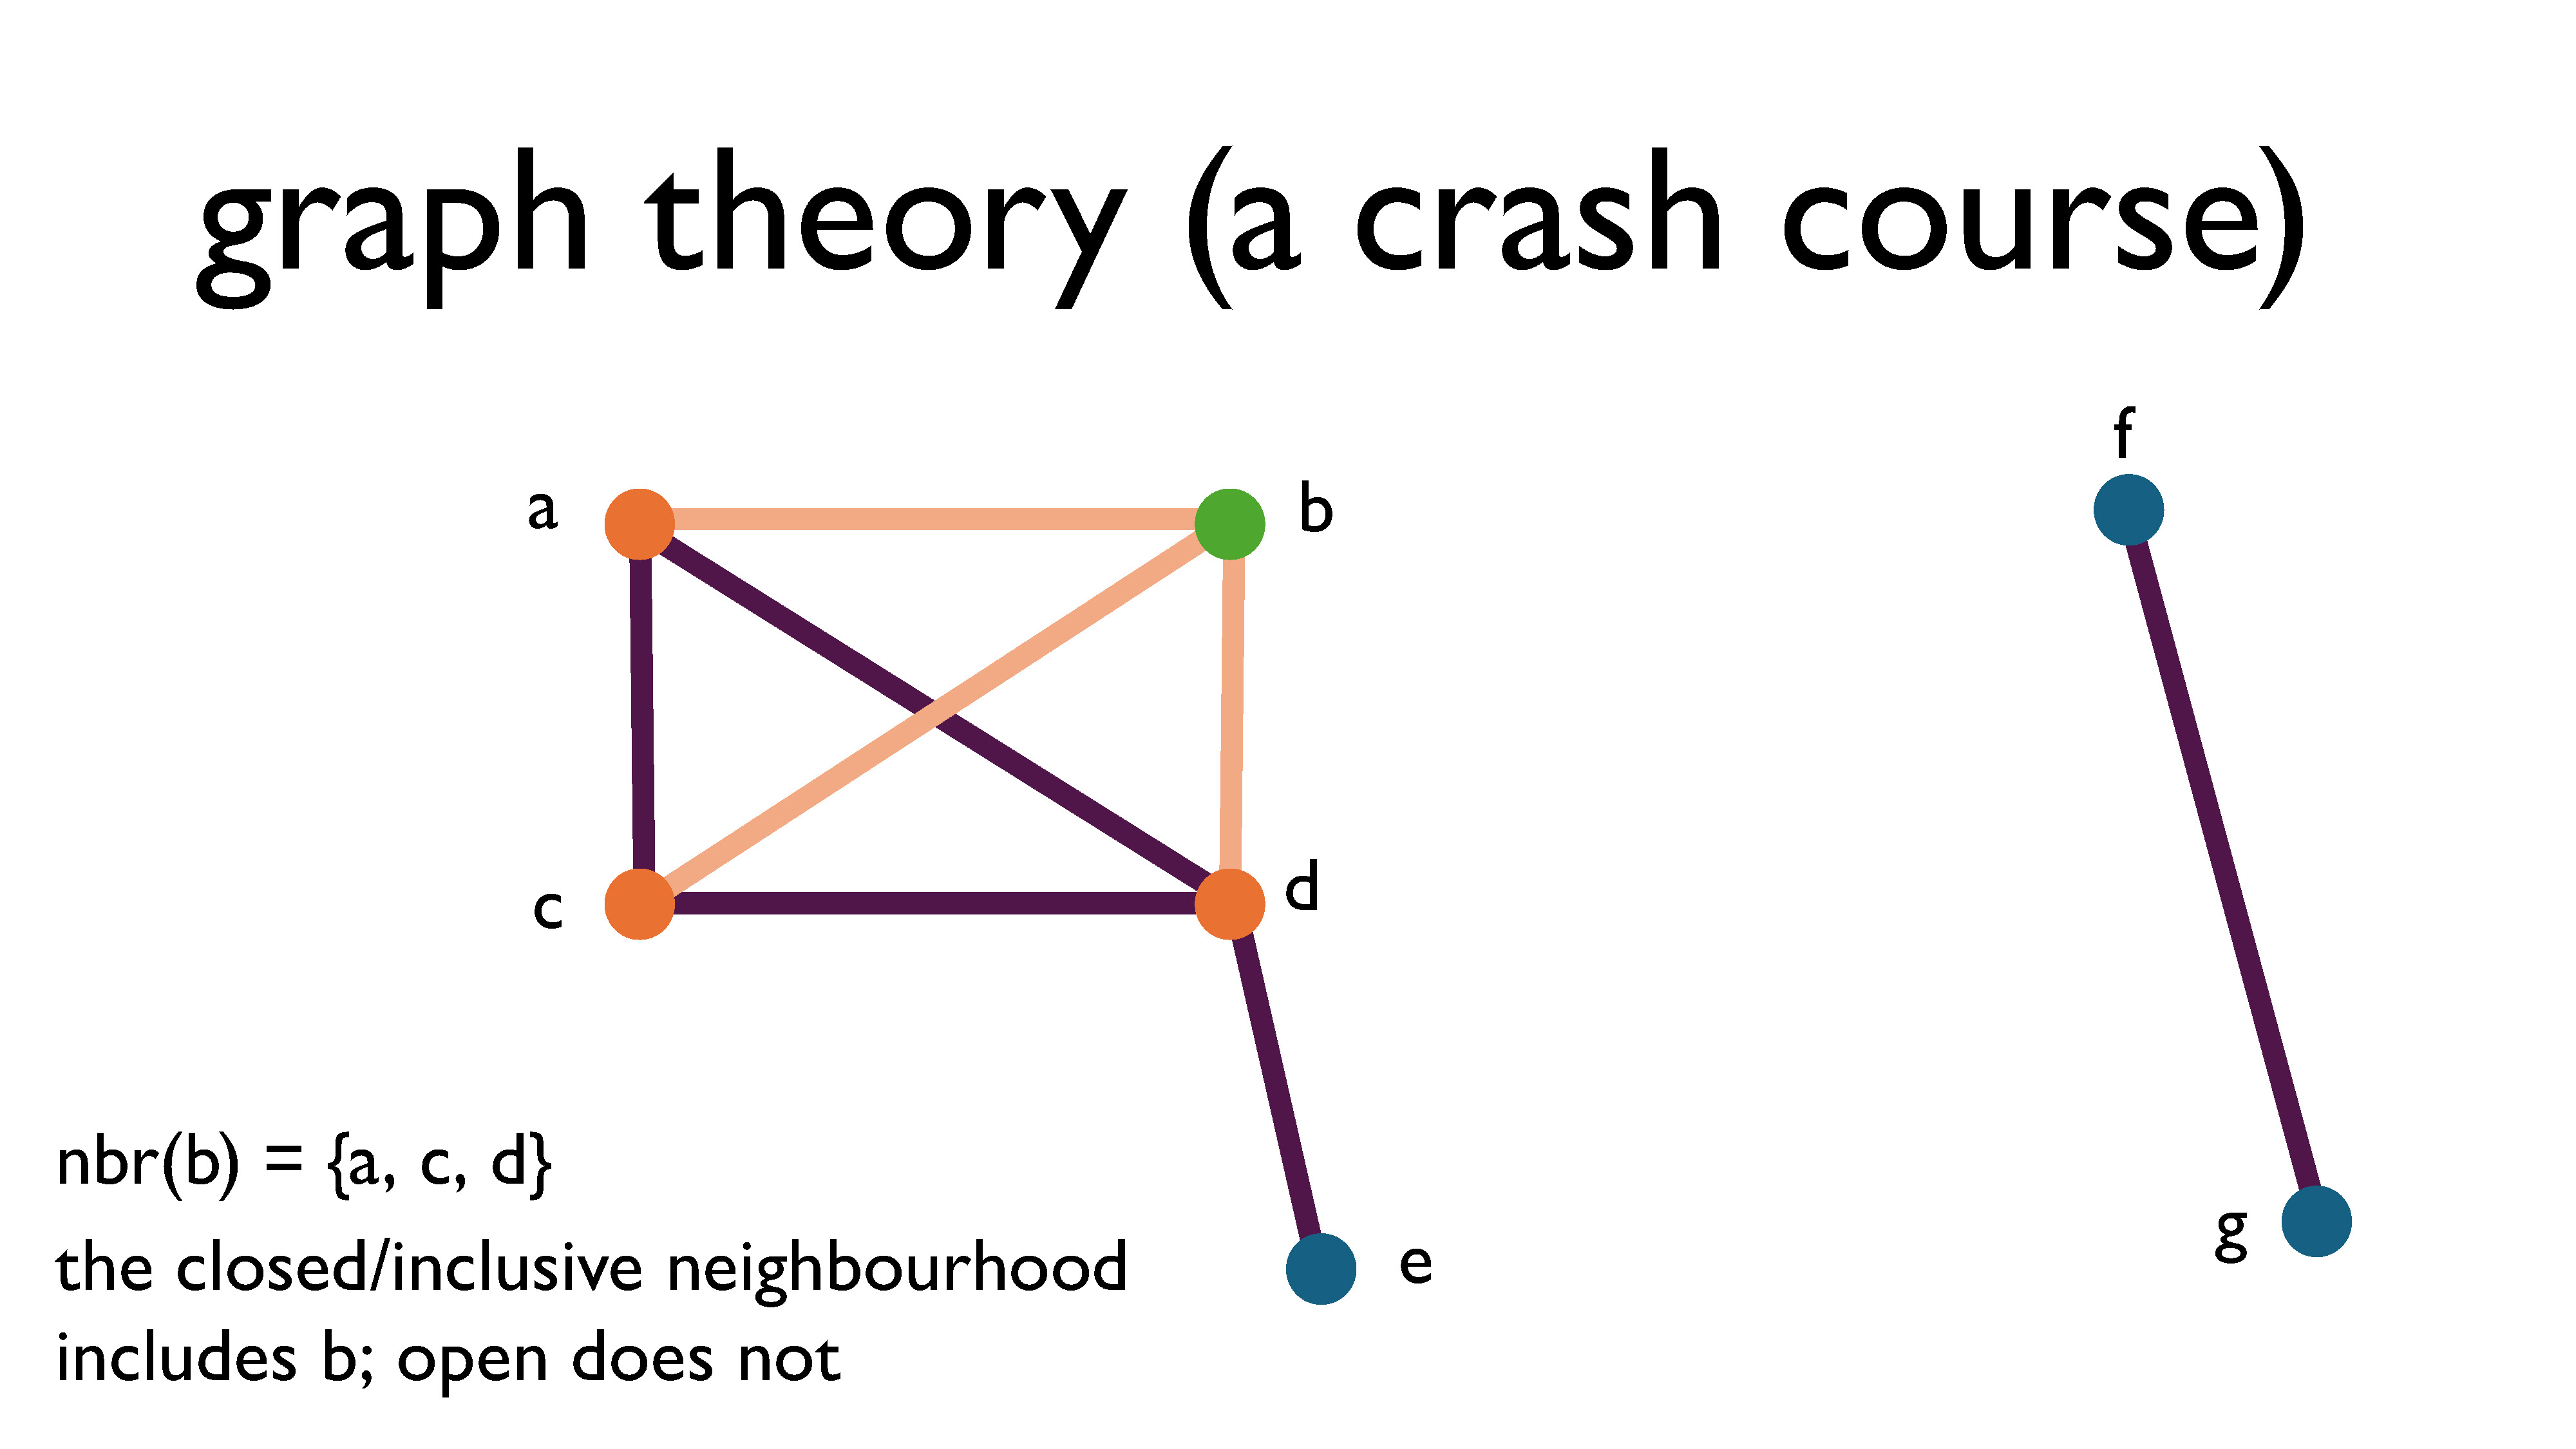
The neighbourhood of a vertex is the set of vertices it shares edges with. When we say the word neighbourhood on its own, we usually mean the open neighbourhood, which is just the vertices on the other end of the edges. The closed (or sometime you’ll hear “inclusive”) neighbourhood includes the original vertex.
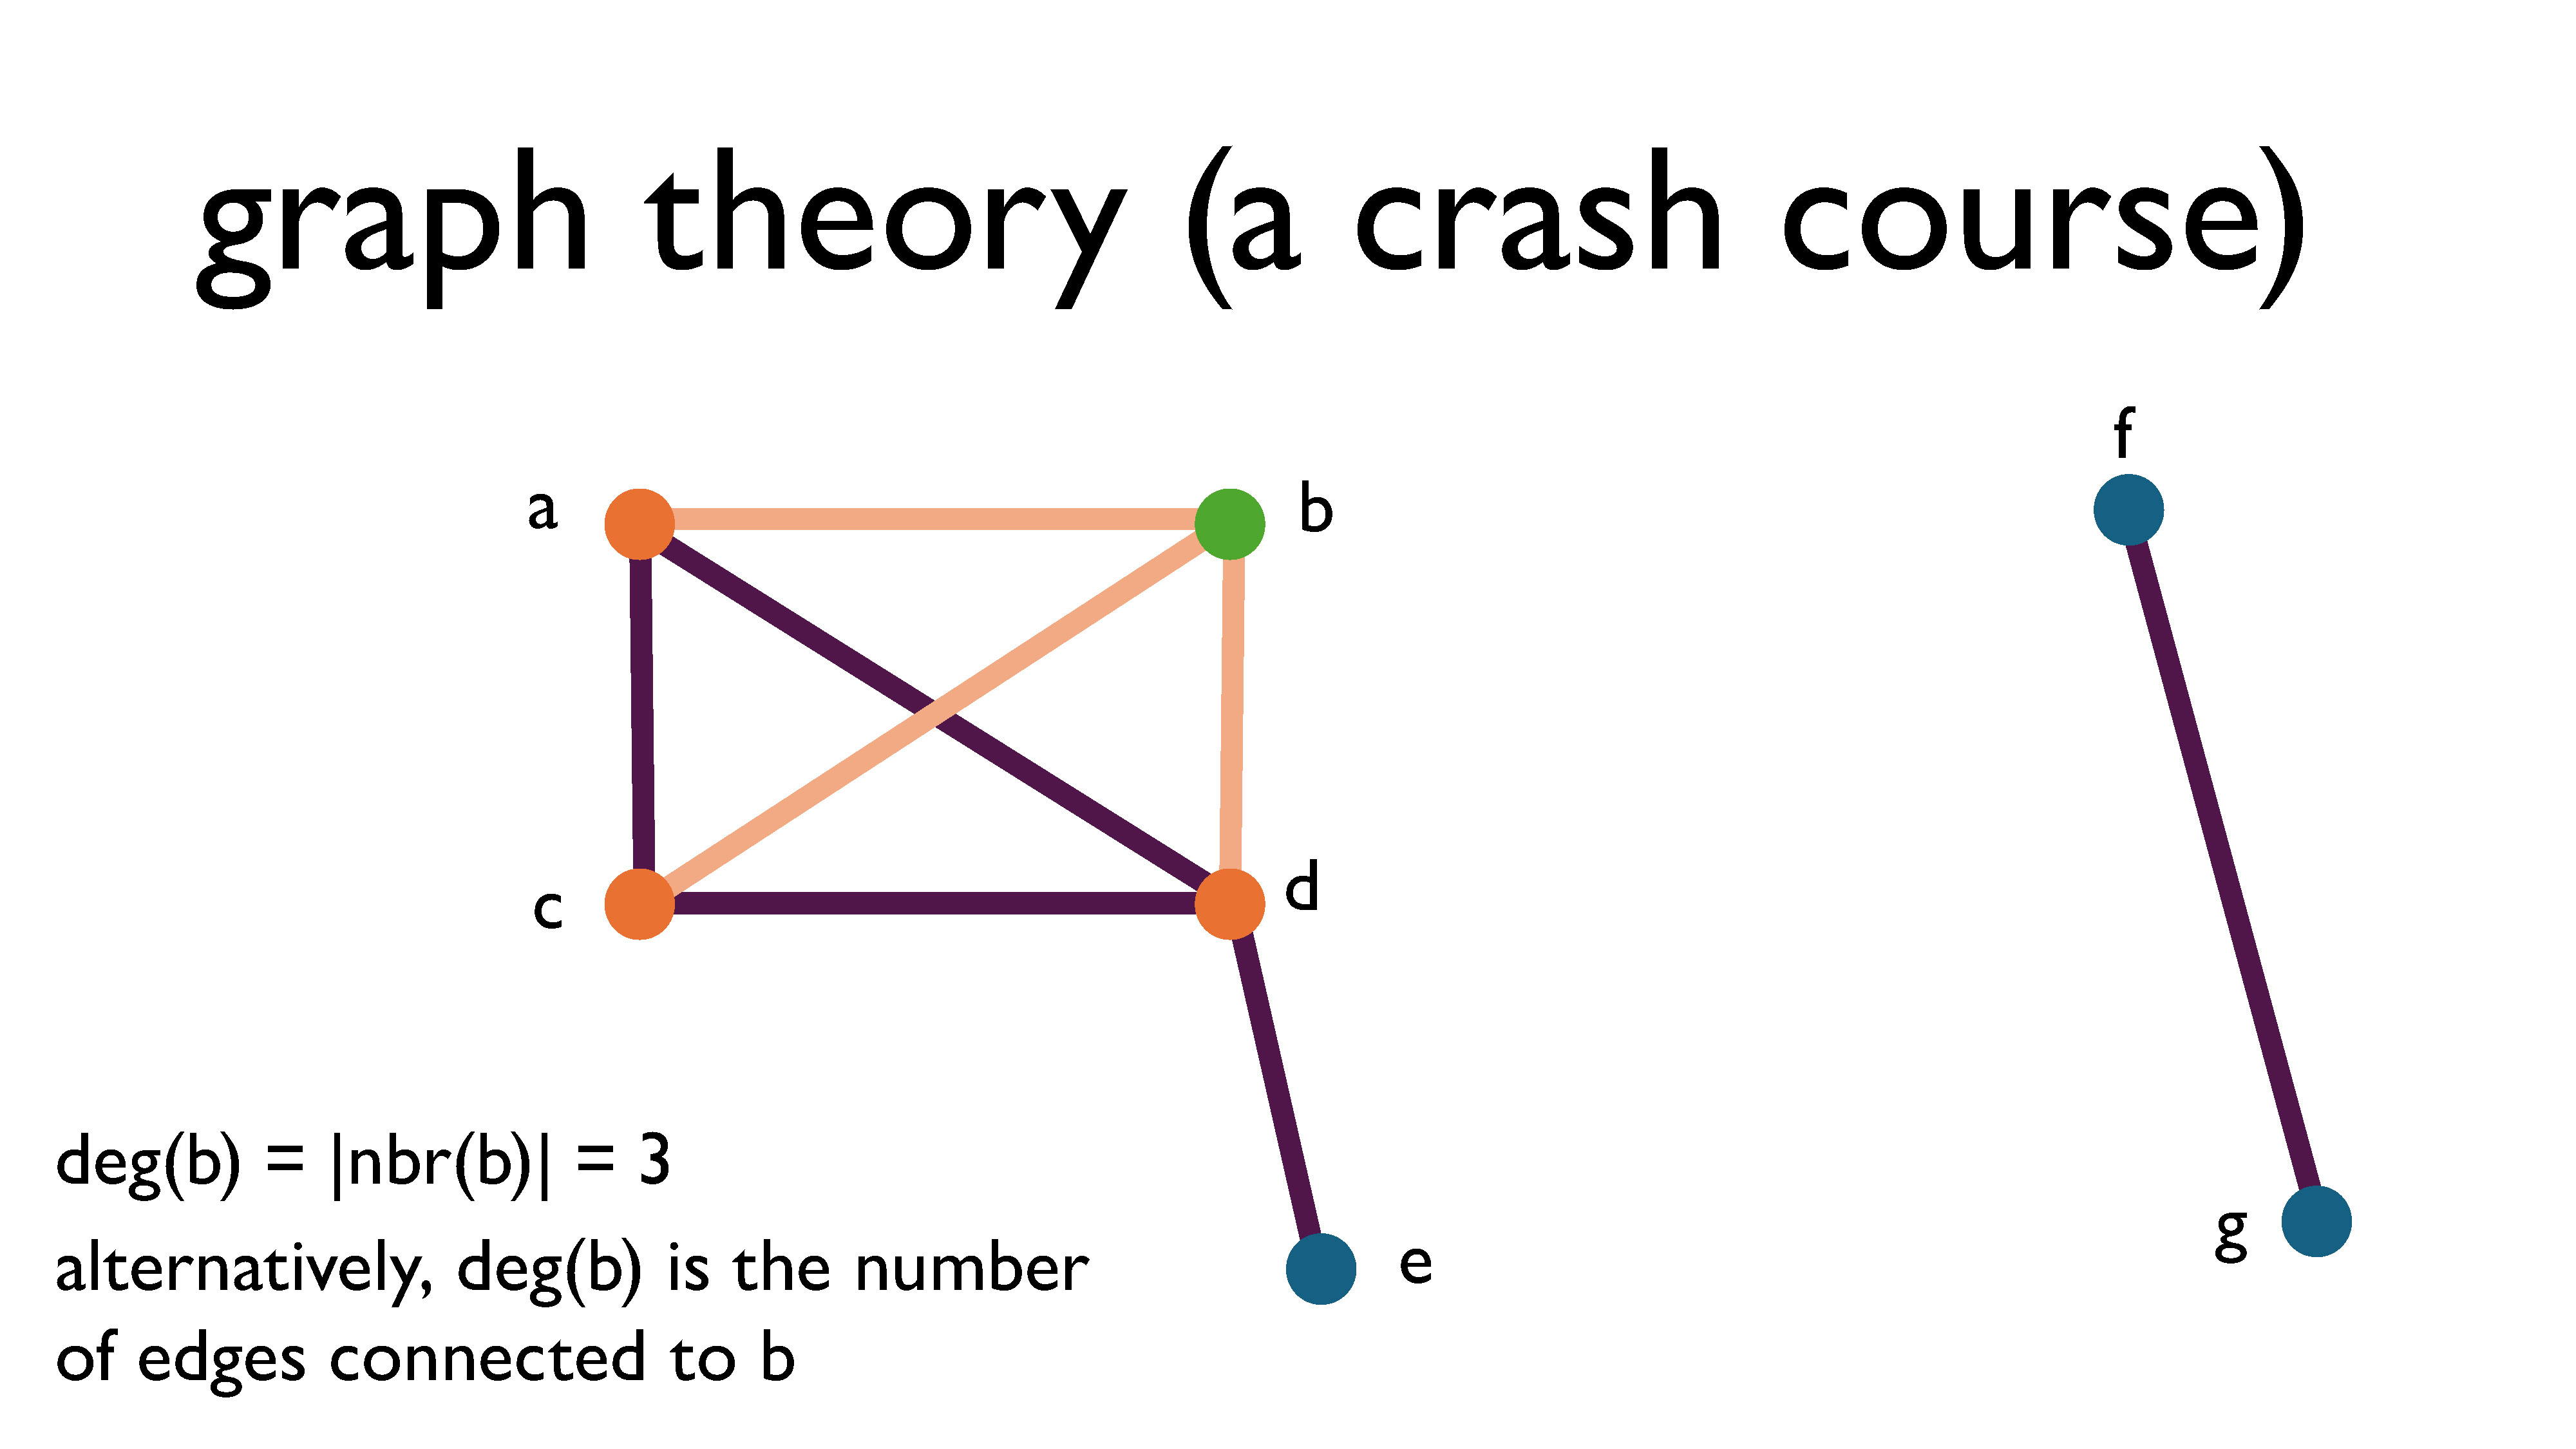
The degree of a vertex is the size of its open neighbourhood, aka the number of edges connected to it. For directed graphs, we instead have the concept of in-degrees and outdegrees. The in-degree of a vertex is the number of edges pointing into the vertex, and the out-degree of a vertex is the number of edges pointing away from the vertex.
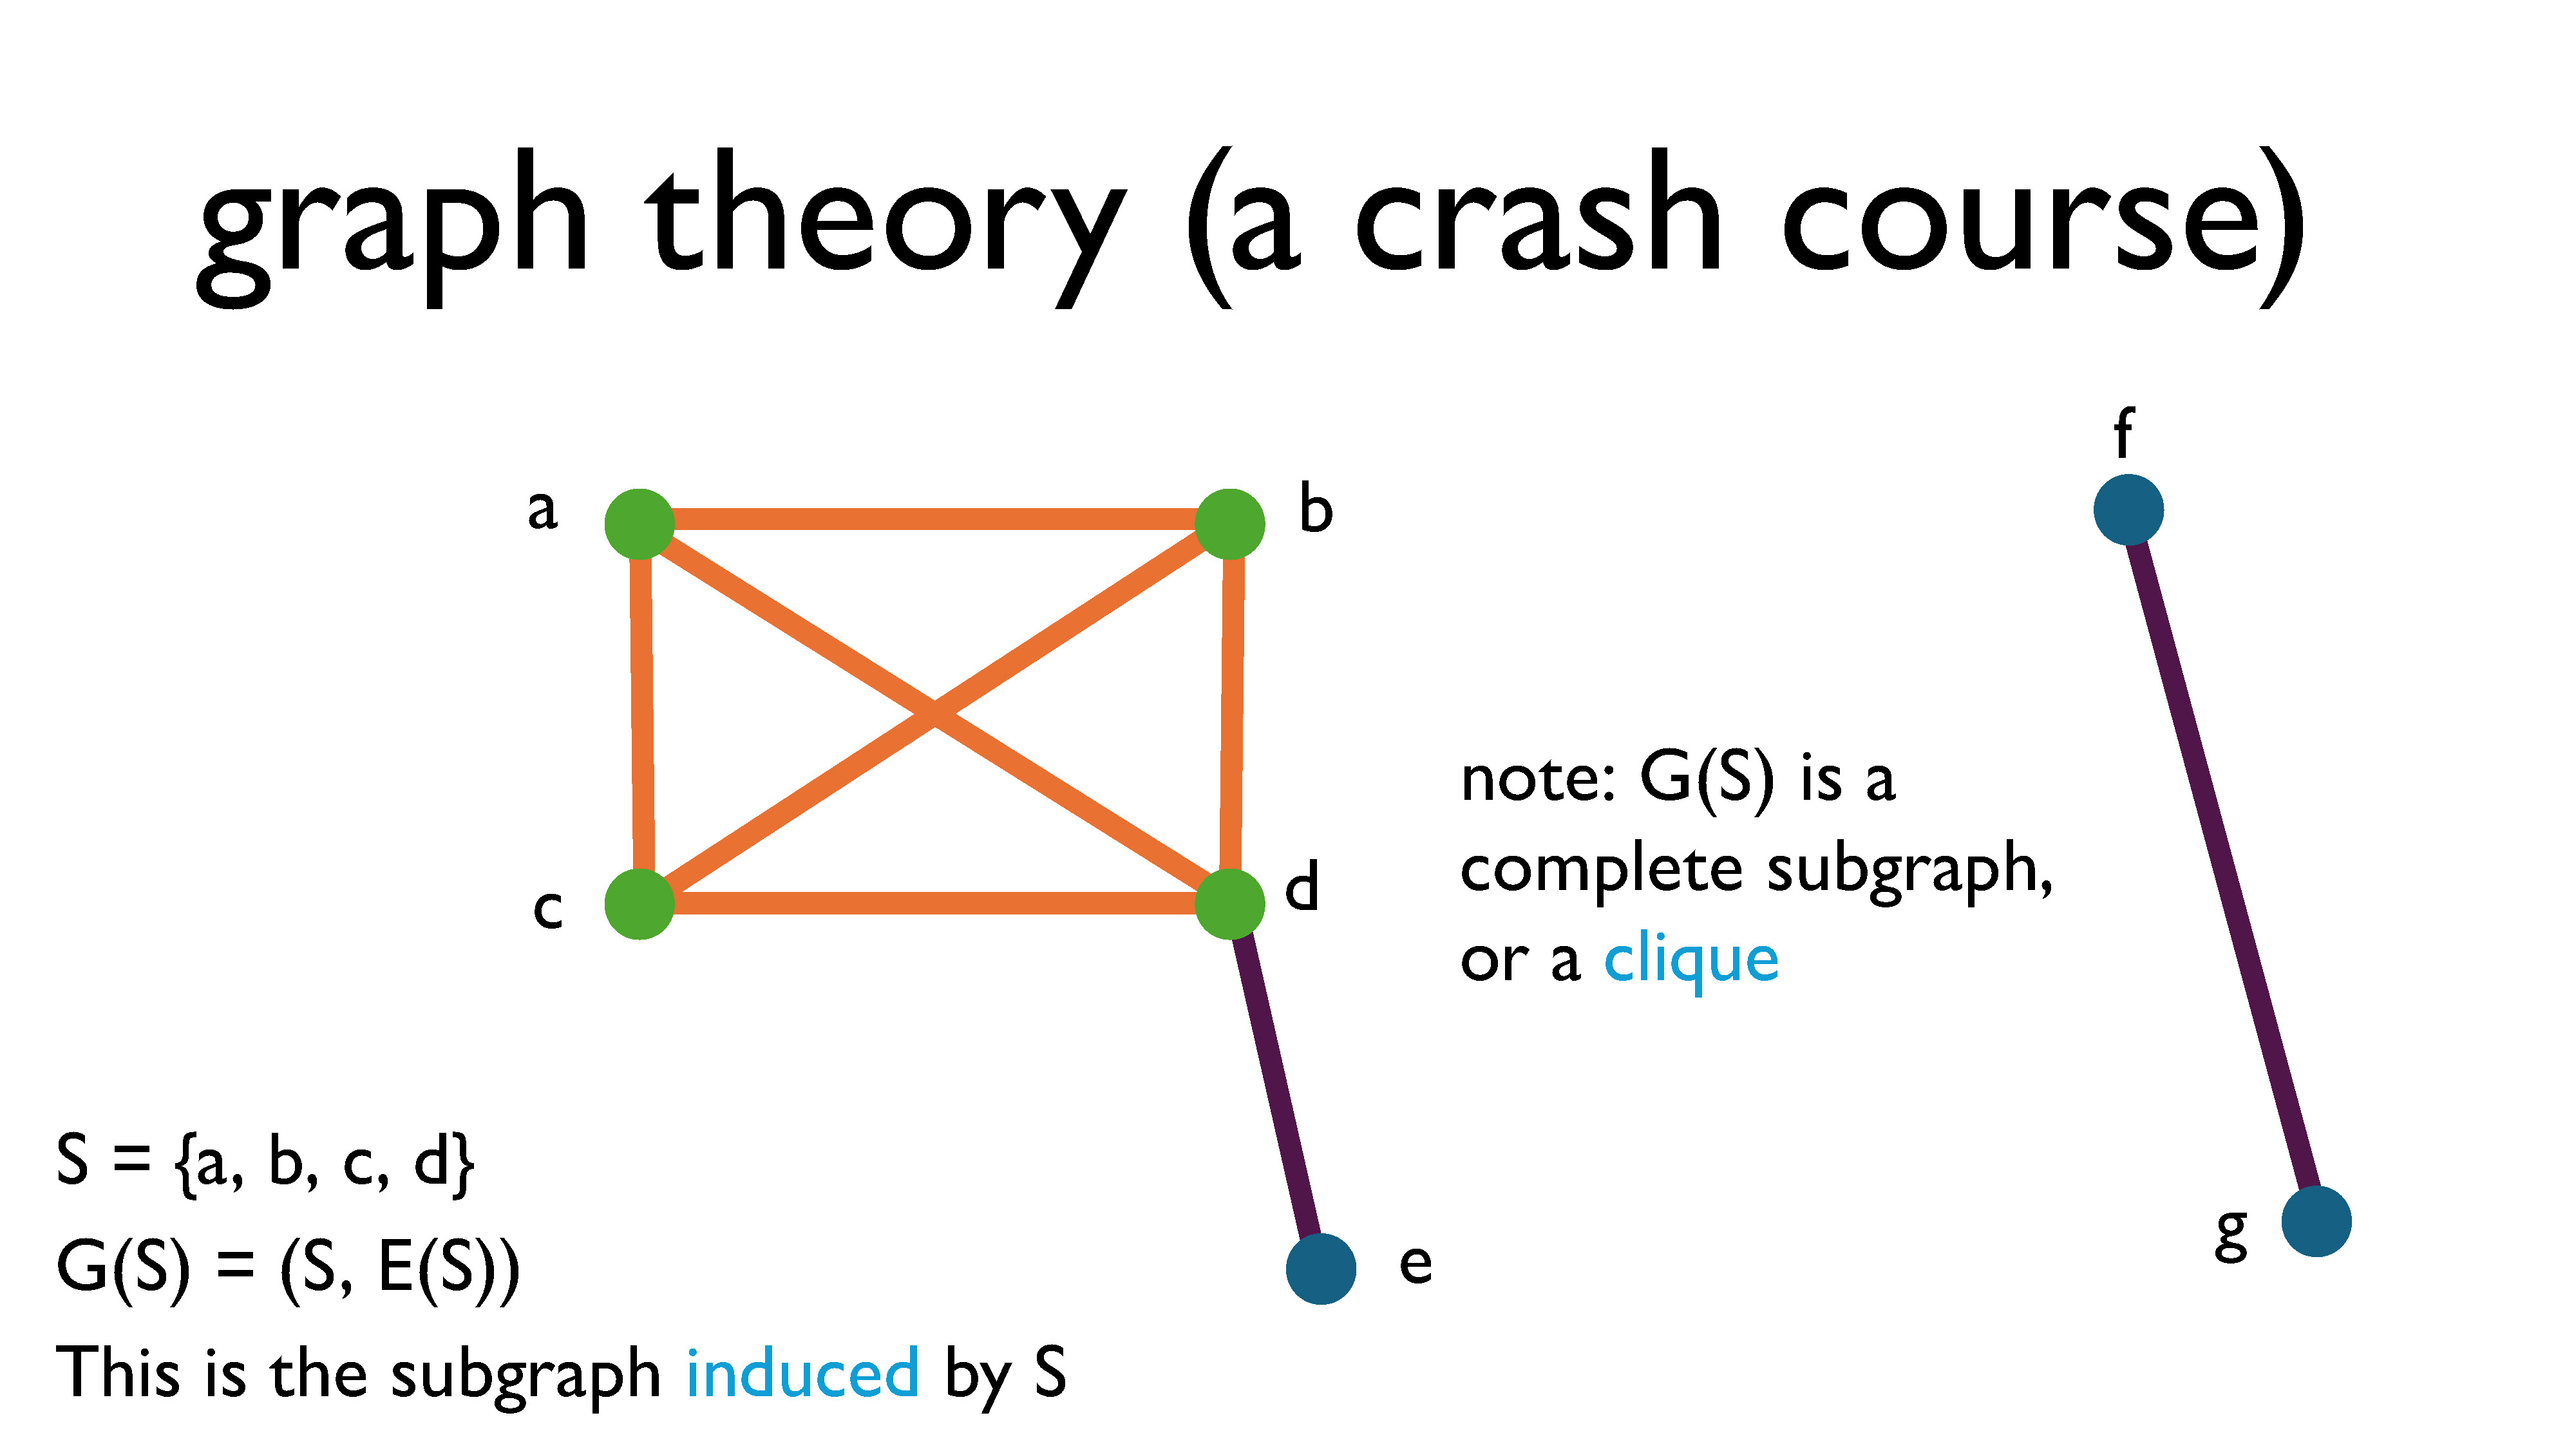
A subgraph is a graph that you get by choosing some of the nodes and some of the edges. If you pick some subset of vertices (let’s call it $S$), and force all of the edges with both endpoints in $S$ to be part of the subgraph, we call that the subgraph induced by $S$ and denote it $G[S]$ (this is the orange and green part of the graph shown above). We denote the edge set of $G[S]$ by $E(S)$.
A graph is called complete if all of its vertices shares edges with every vertex. The complete graph on $n$ vertices is denoted $K_n.$ A subgraph is called a clique if it’s a complete subgraph.

Okay, so maybe that was a lot to digest, especially if you’ve never seen graph theory. However, this was really just meant to be a crash course to introduce basic ideas and definitions. But now we’re equipped to revisit the problems we looked at earlier to see how they’re all connected!
Back to the real-world problems
Let’s go back to our original real-world problems and connect them to graphs.
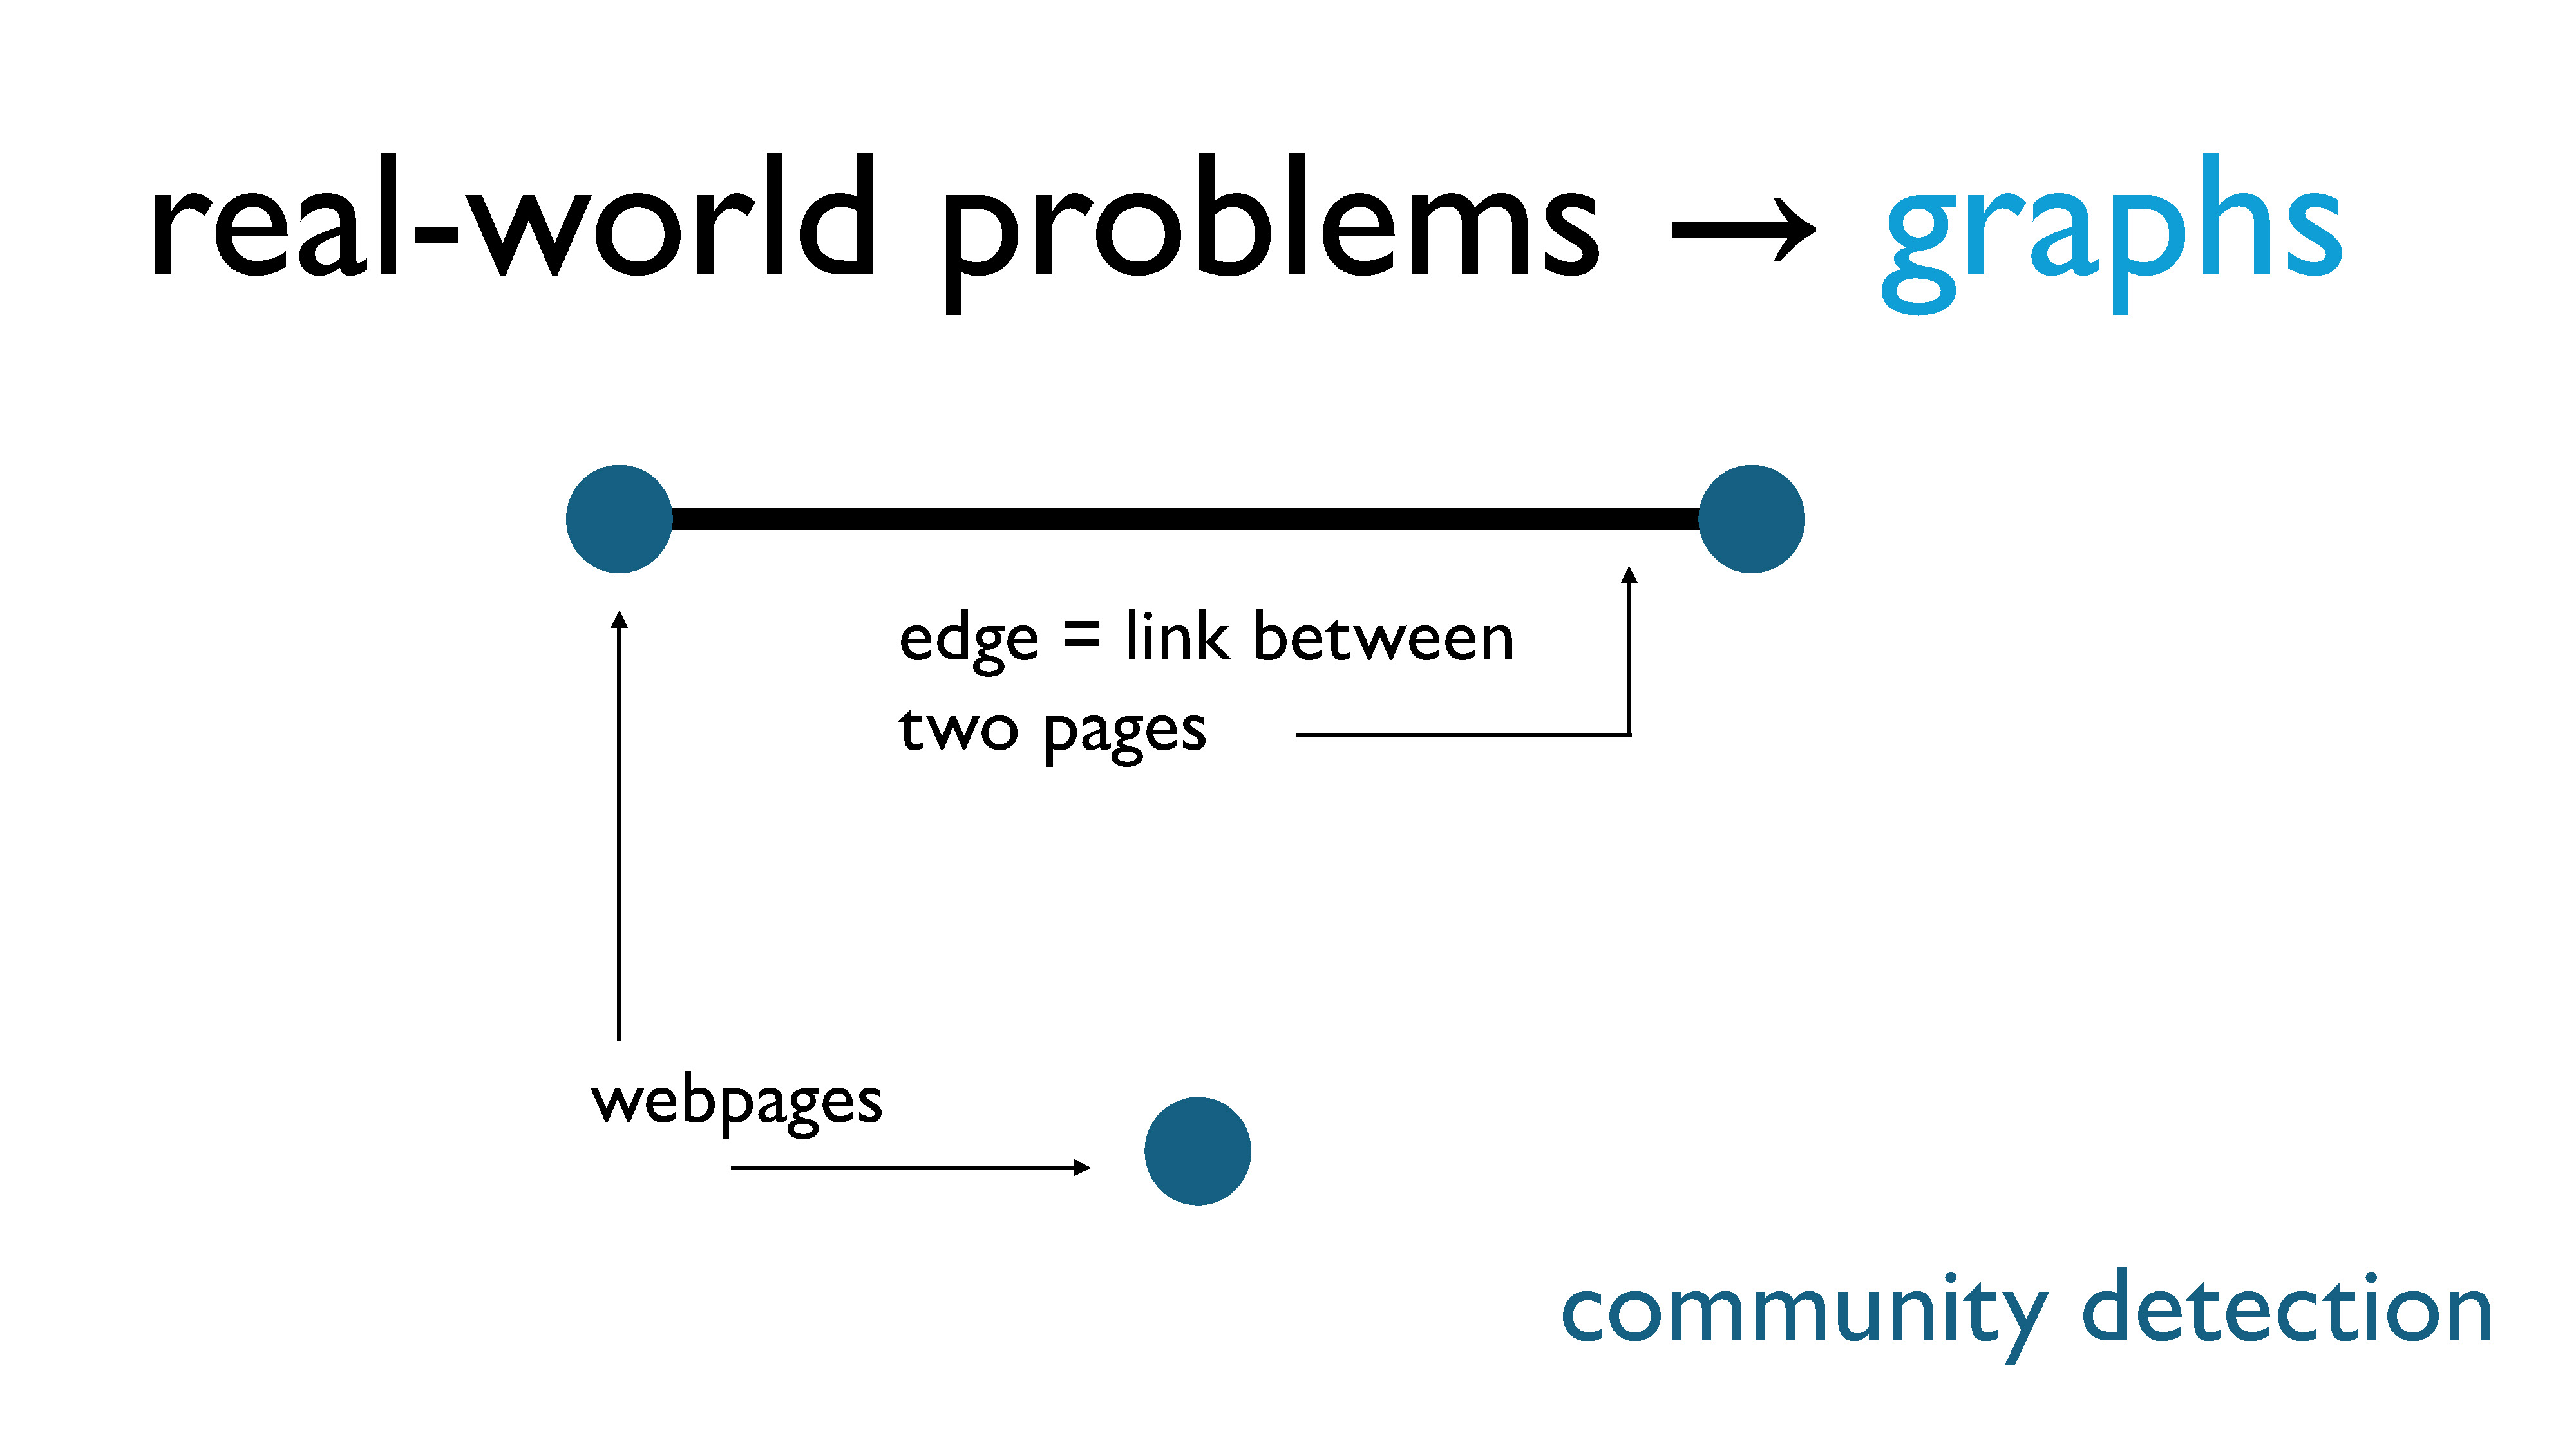
For community detection, the nodes are webpages, and there is an edge between two pages if one page links to the other.
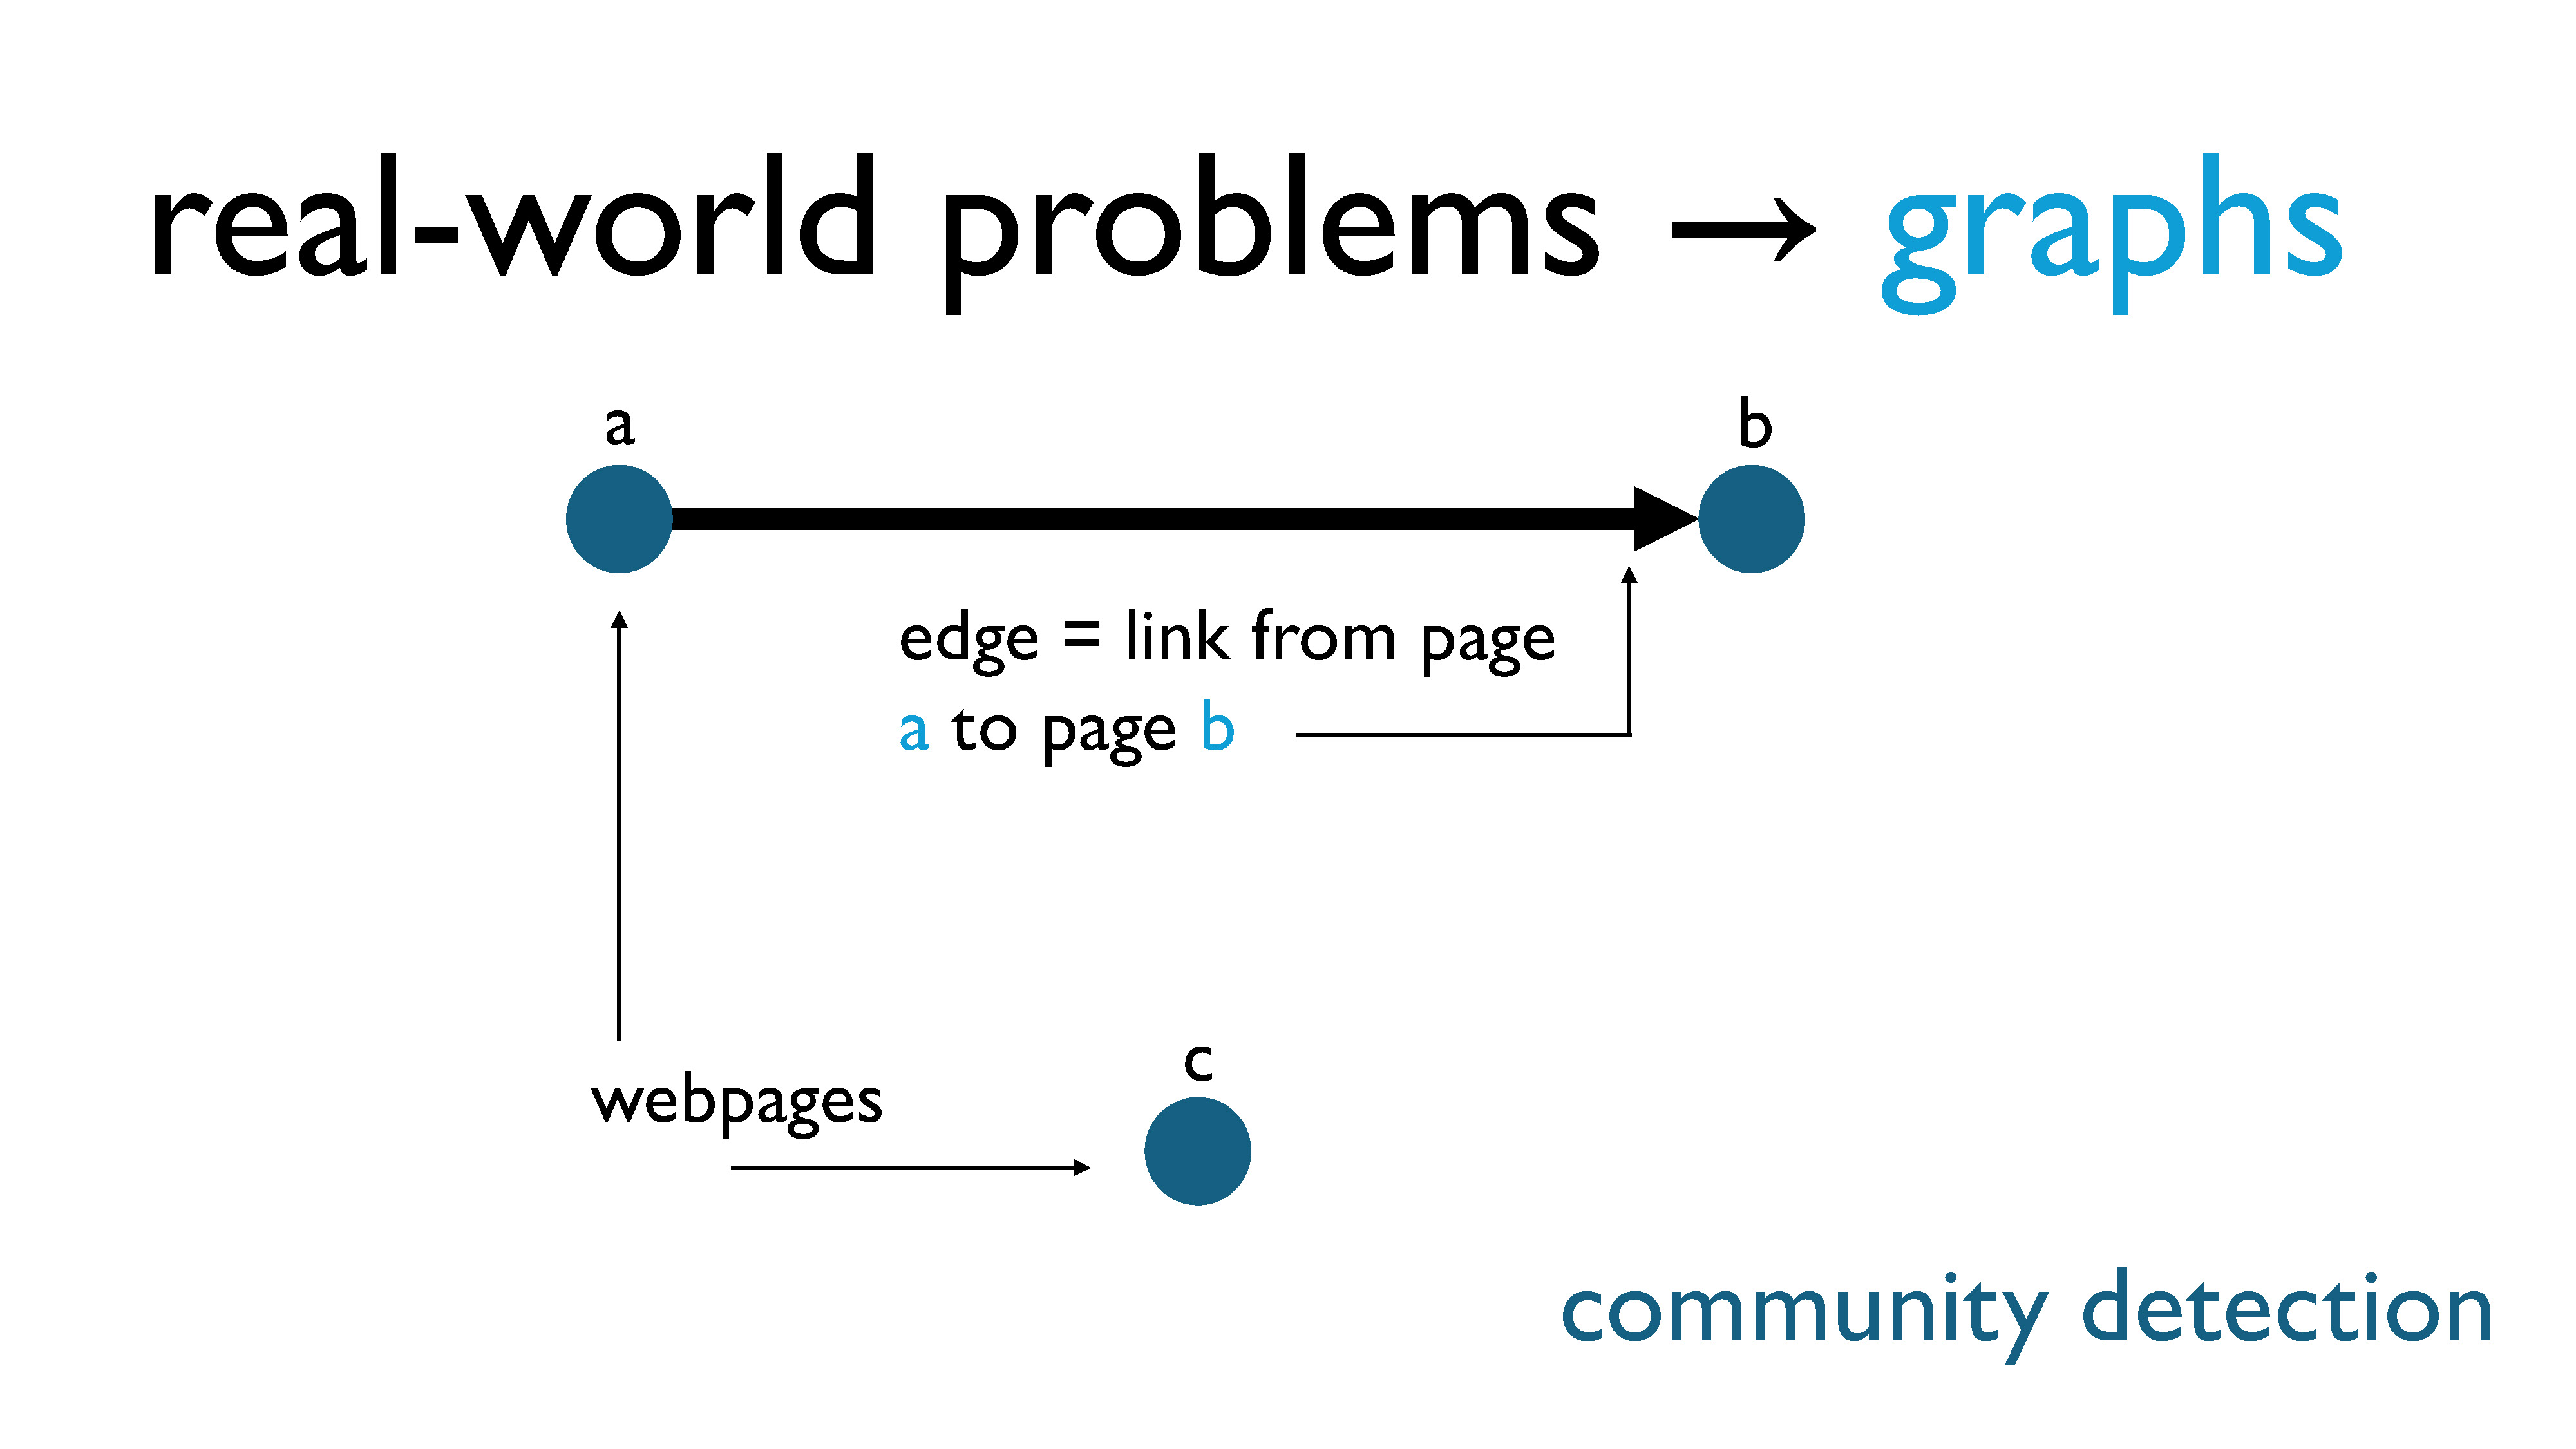
Technically, this should be a directed graph… but we’re just going to ignore that detail.
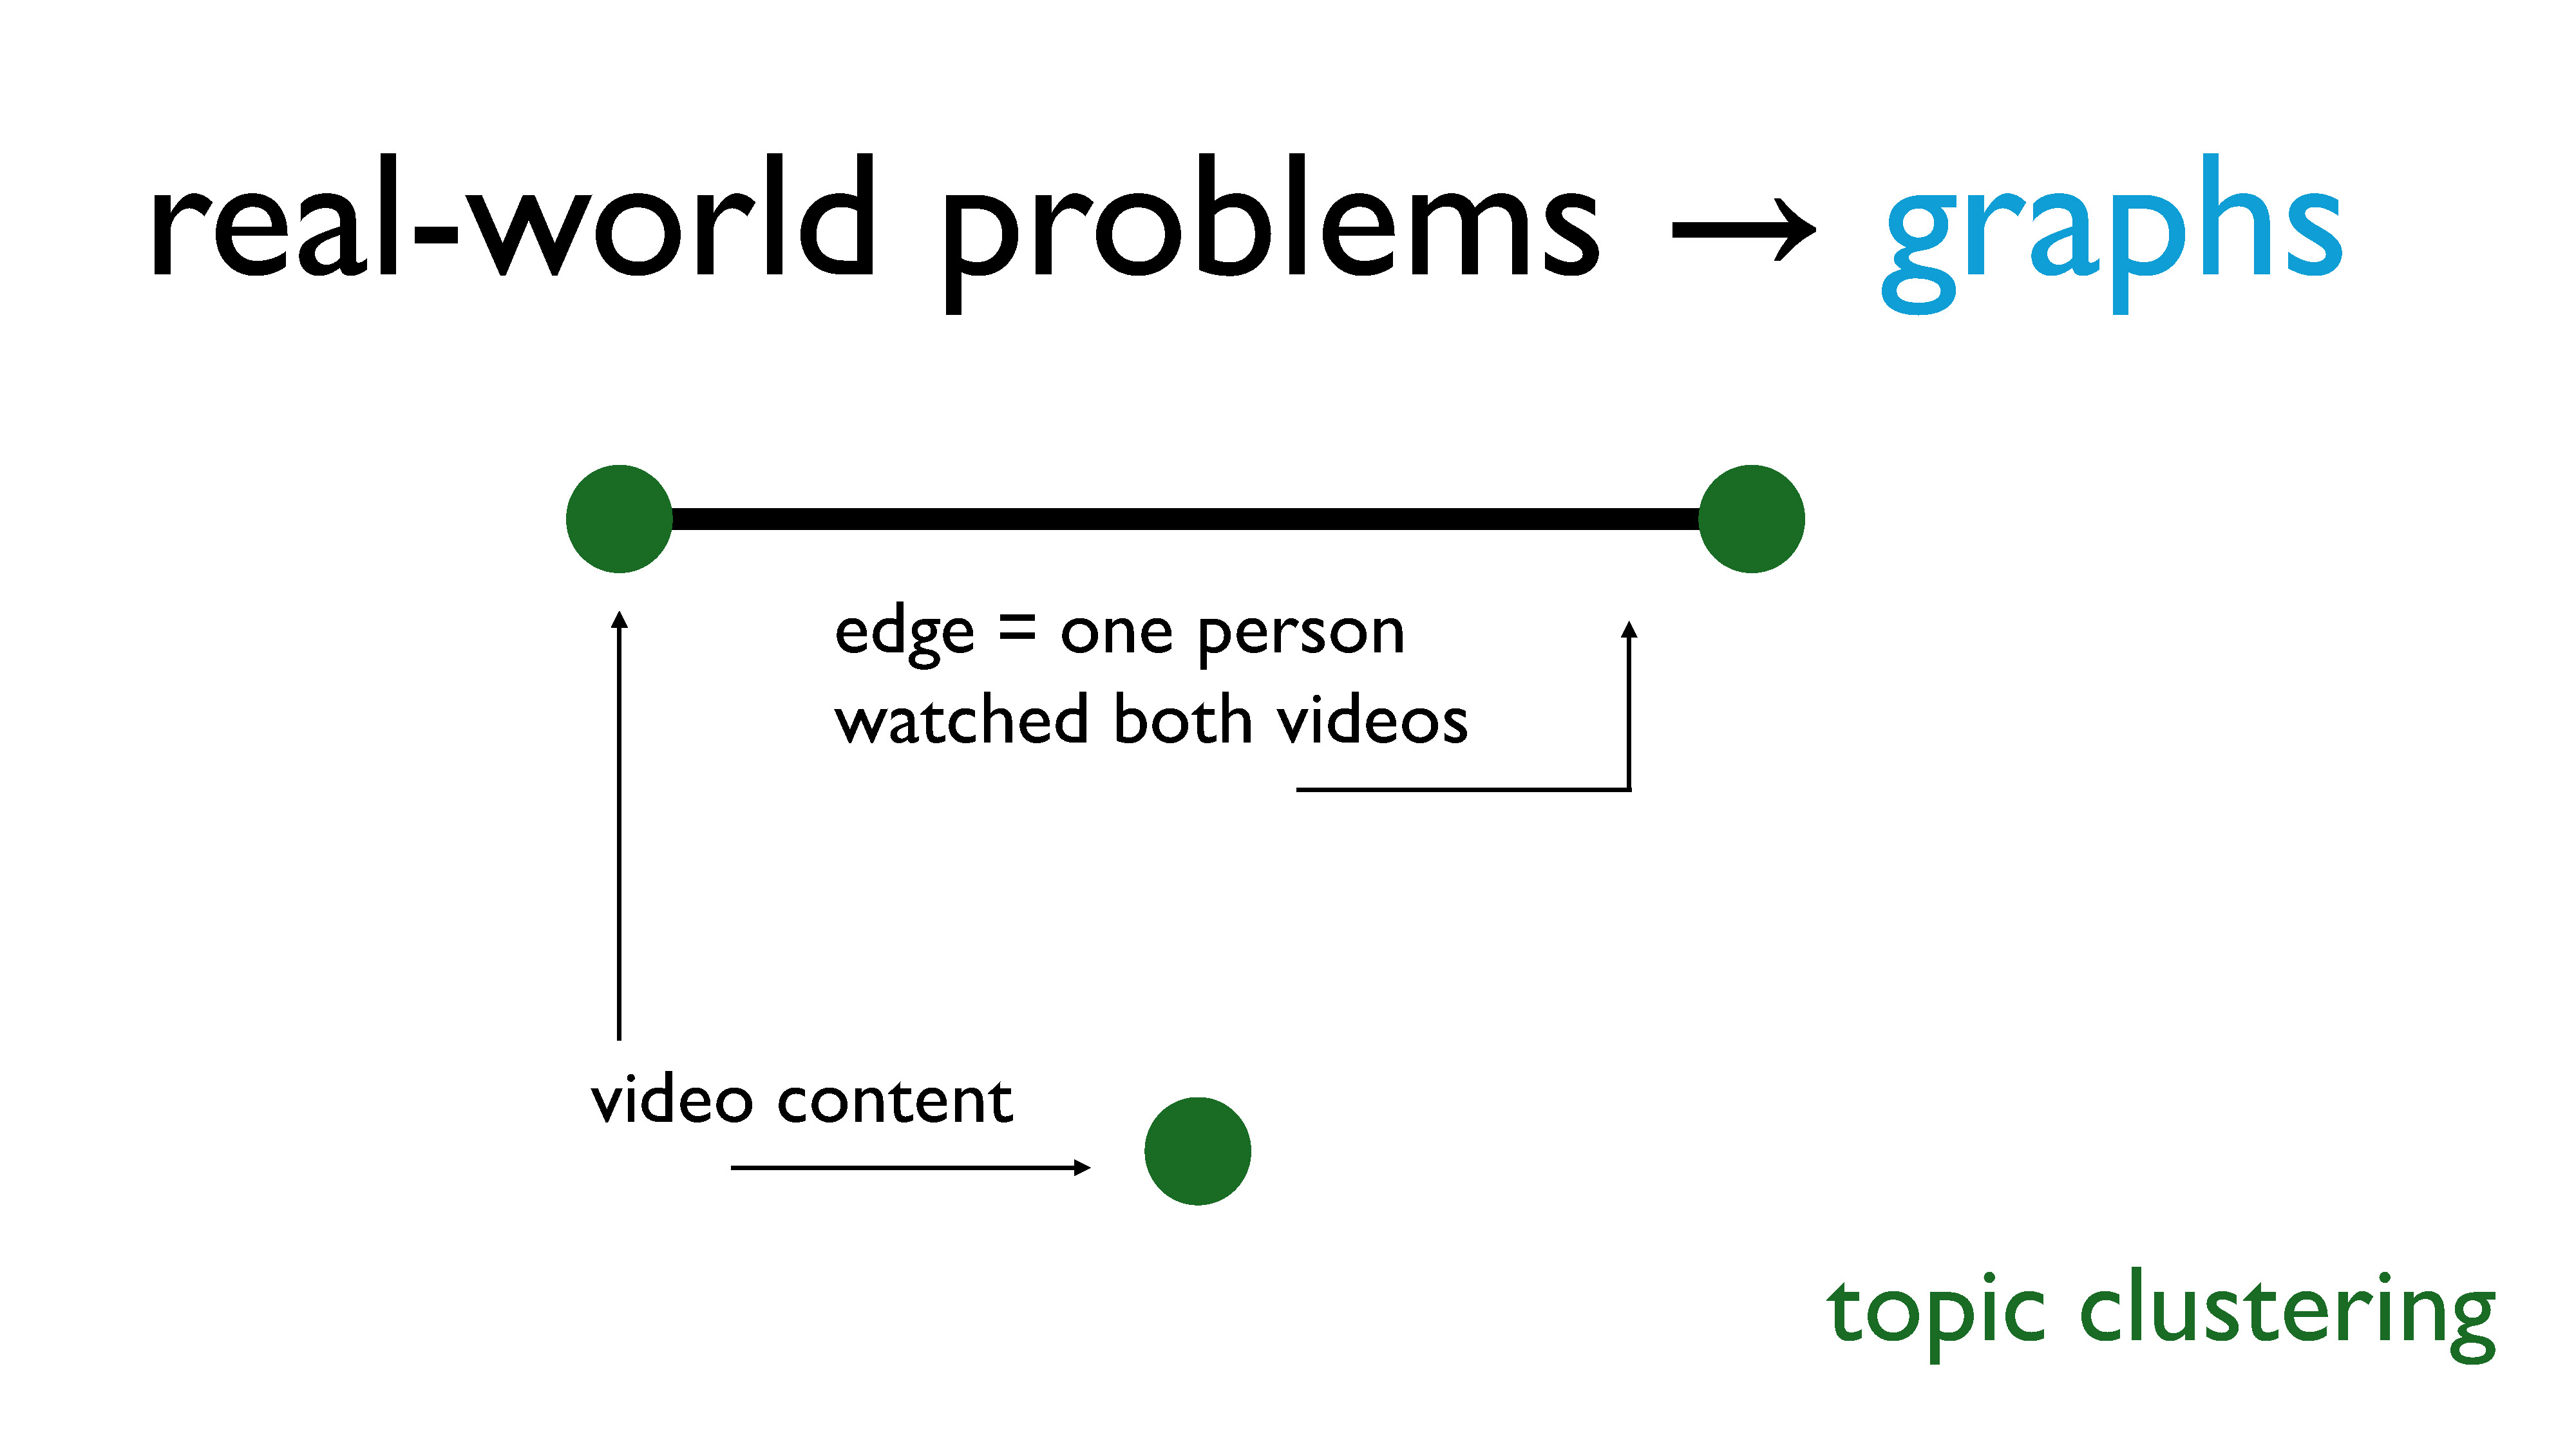
For topic clustering, our nodes are video content, and we put an edge between the two nodes if at least one person has watched both pieces of content.
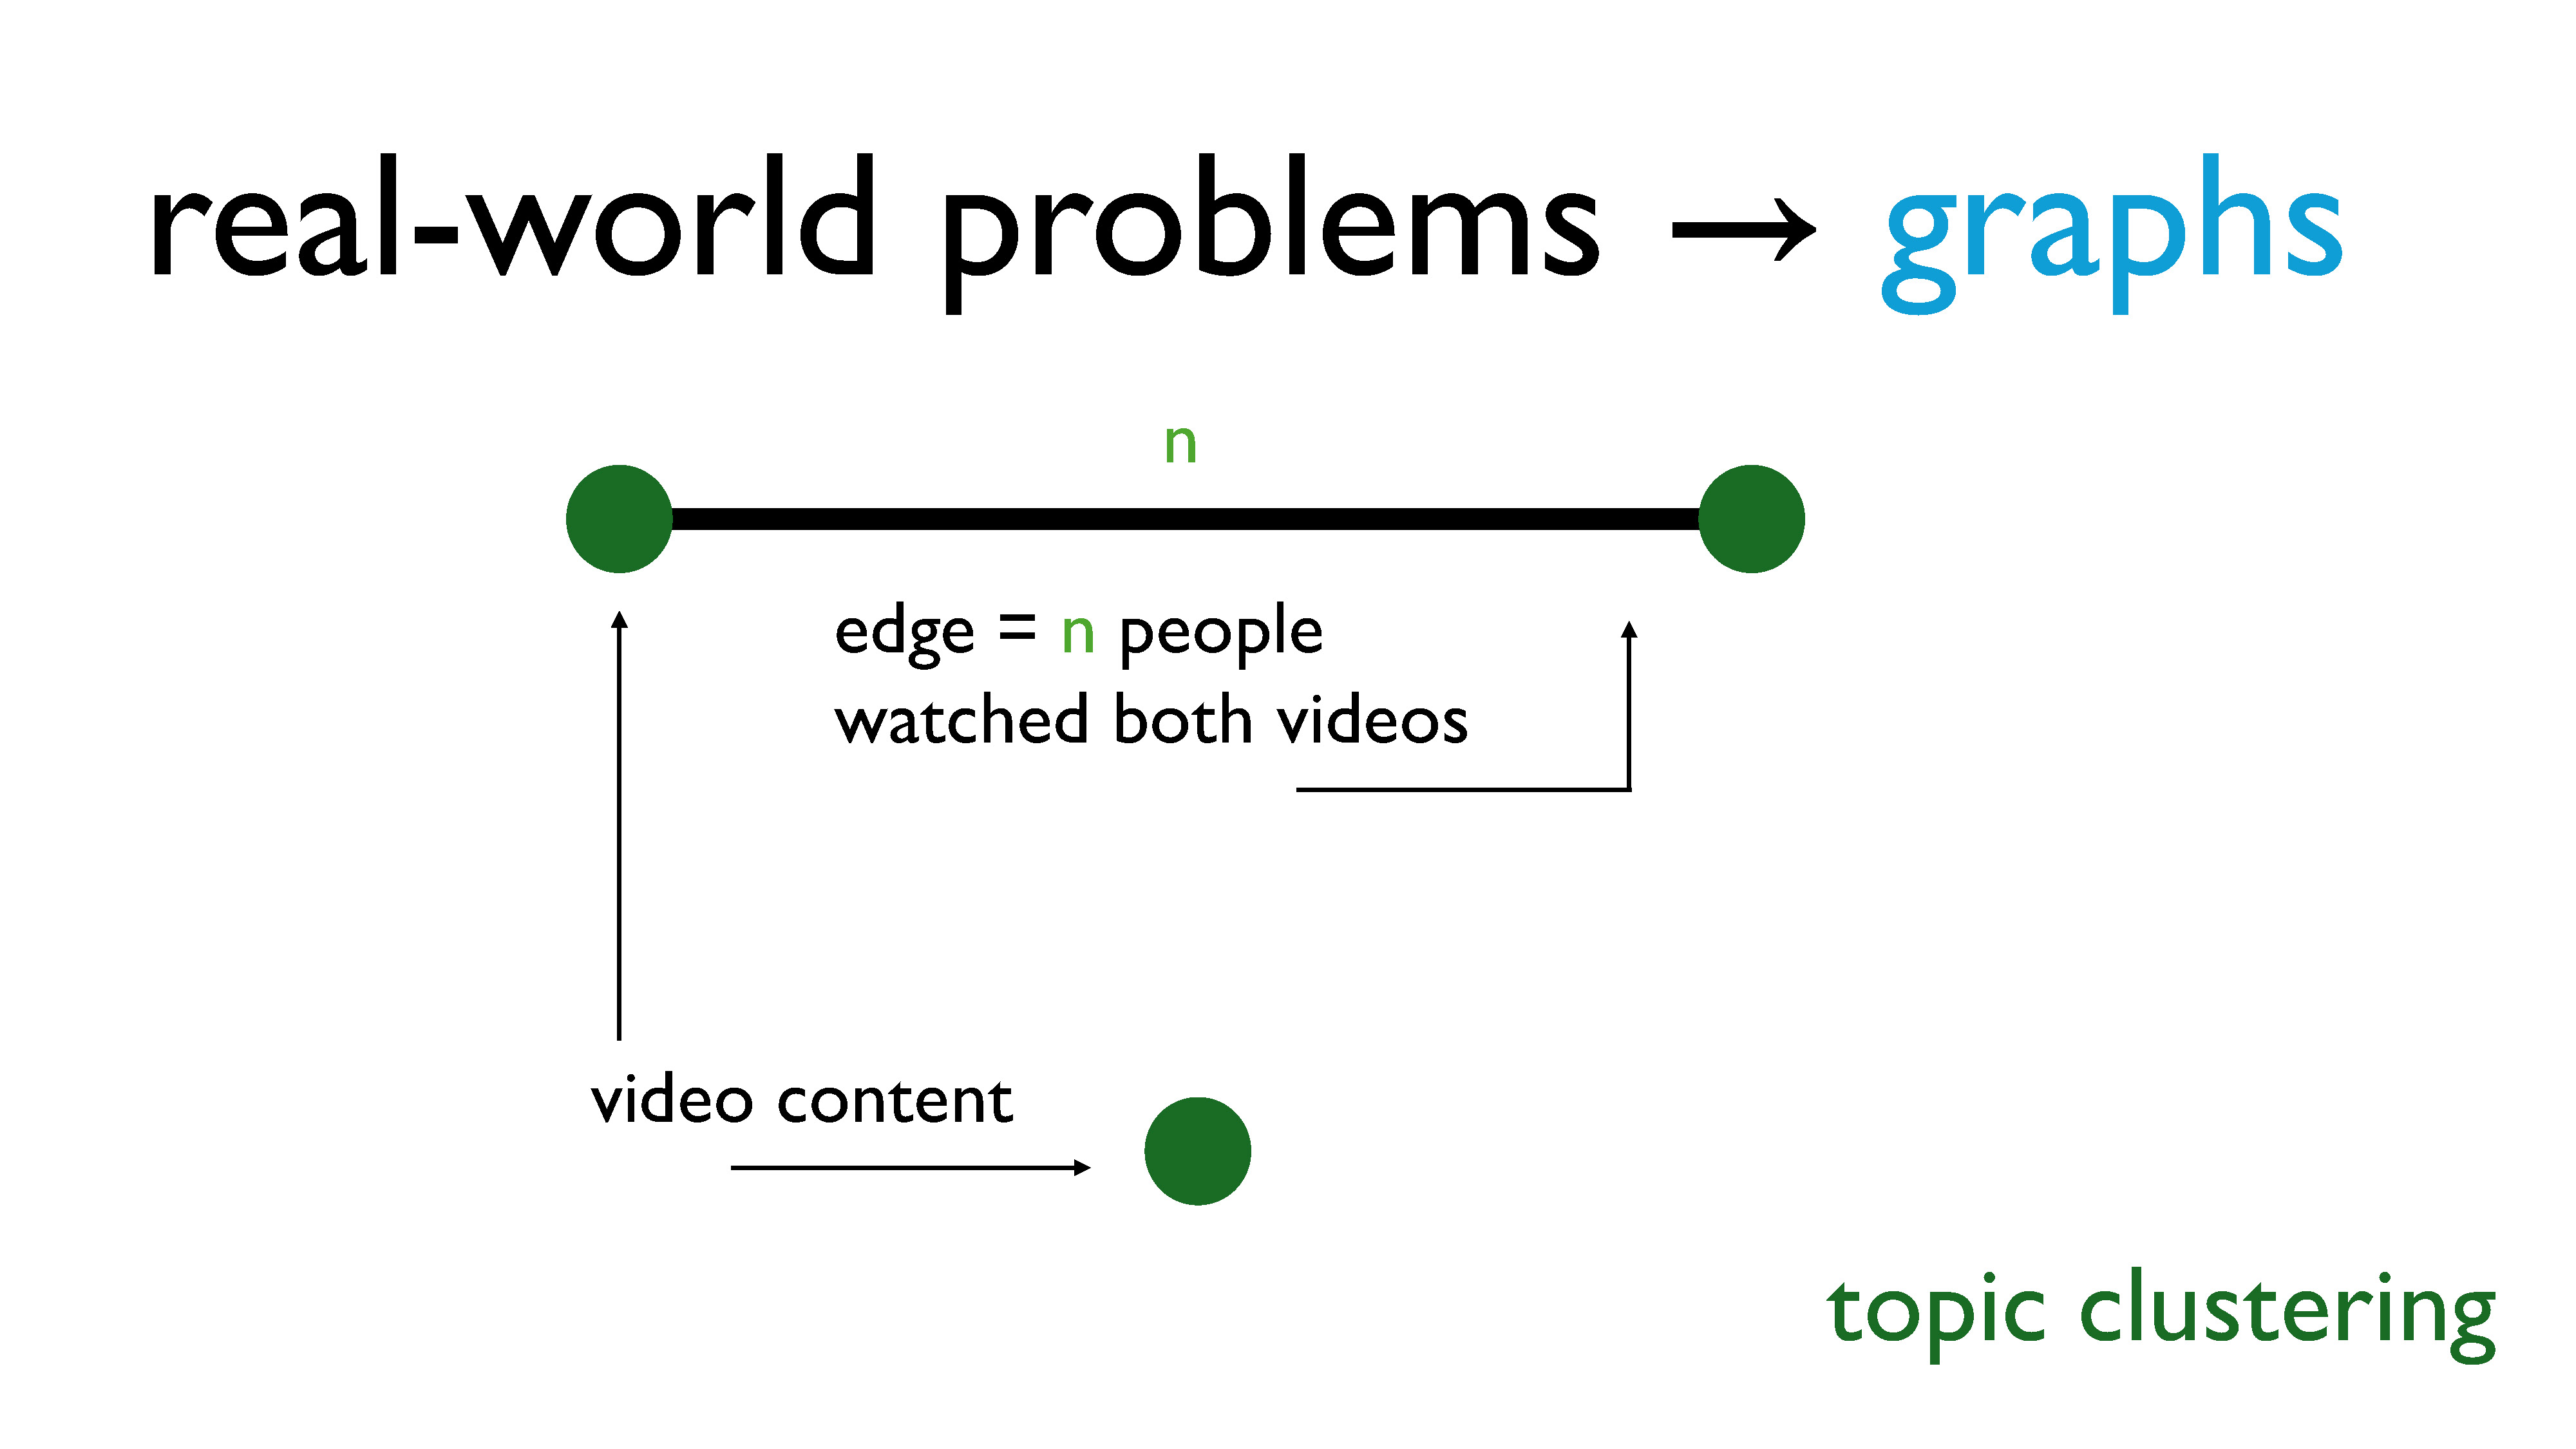
Technically, this is a weighted graph, where the weights are the number of people who have watched both videos. But again, we’re just going to ignore that detail.
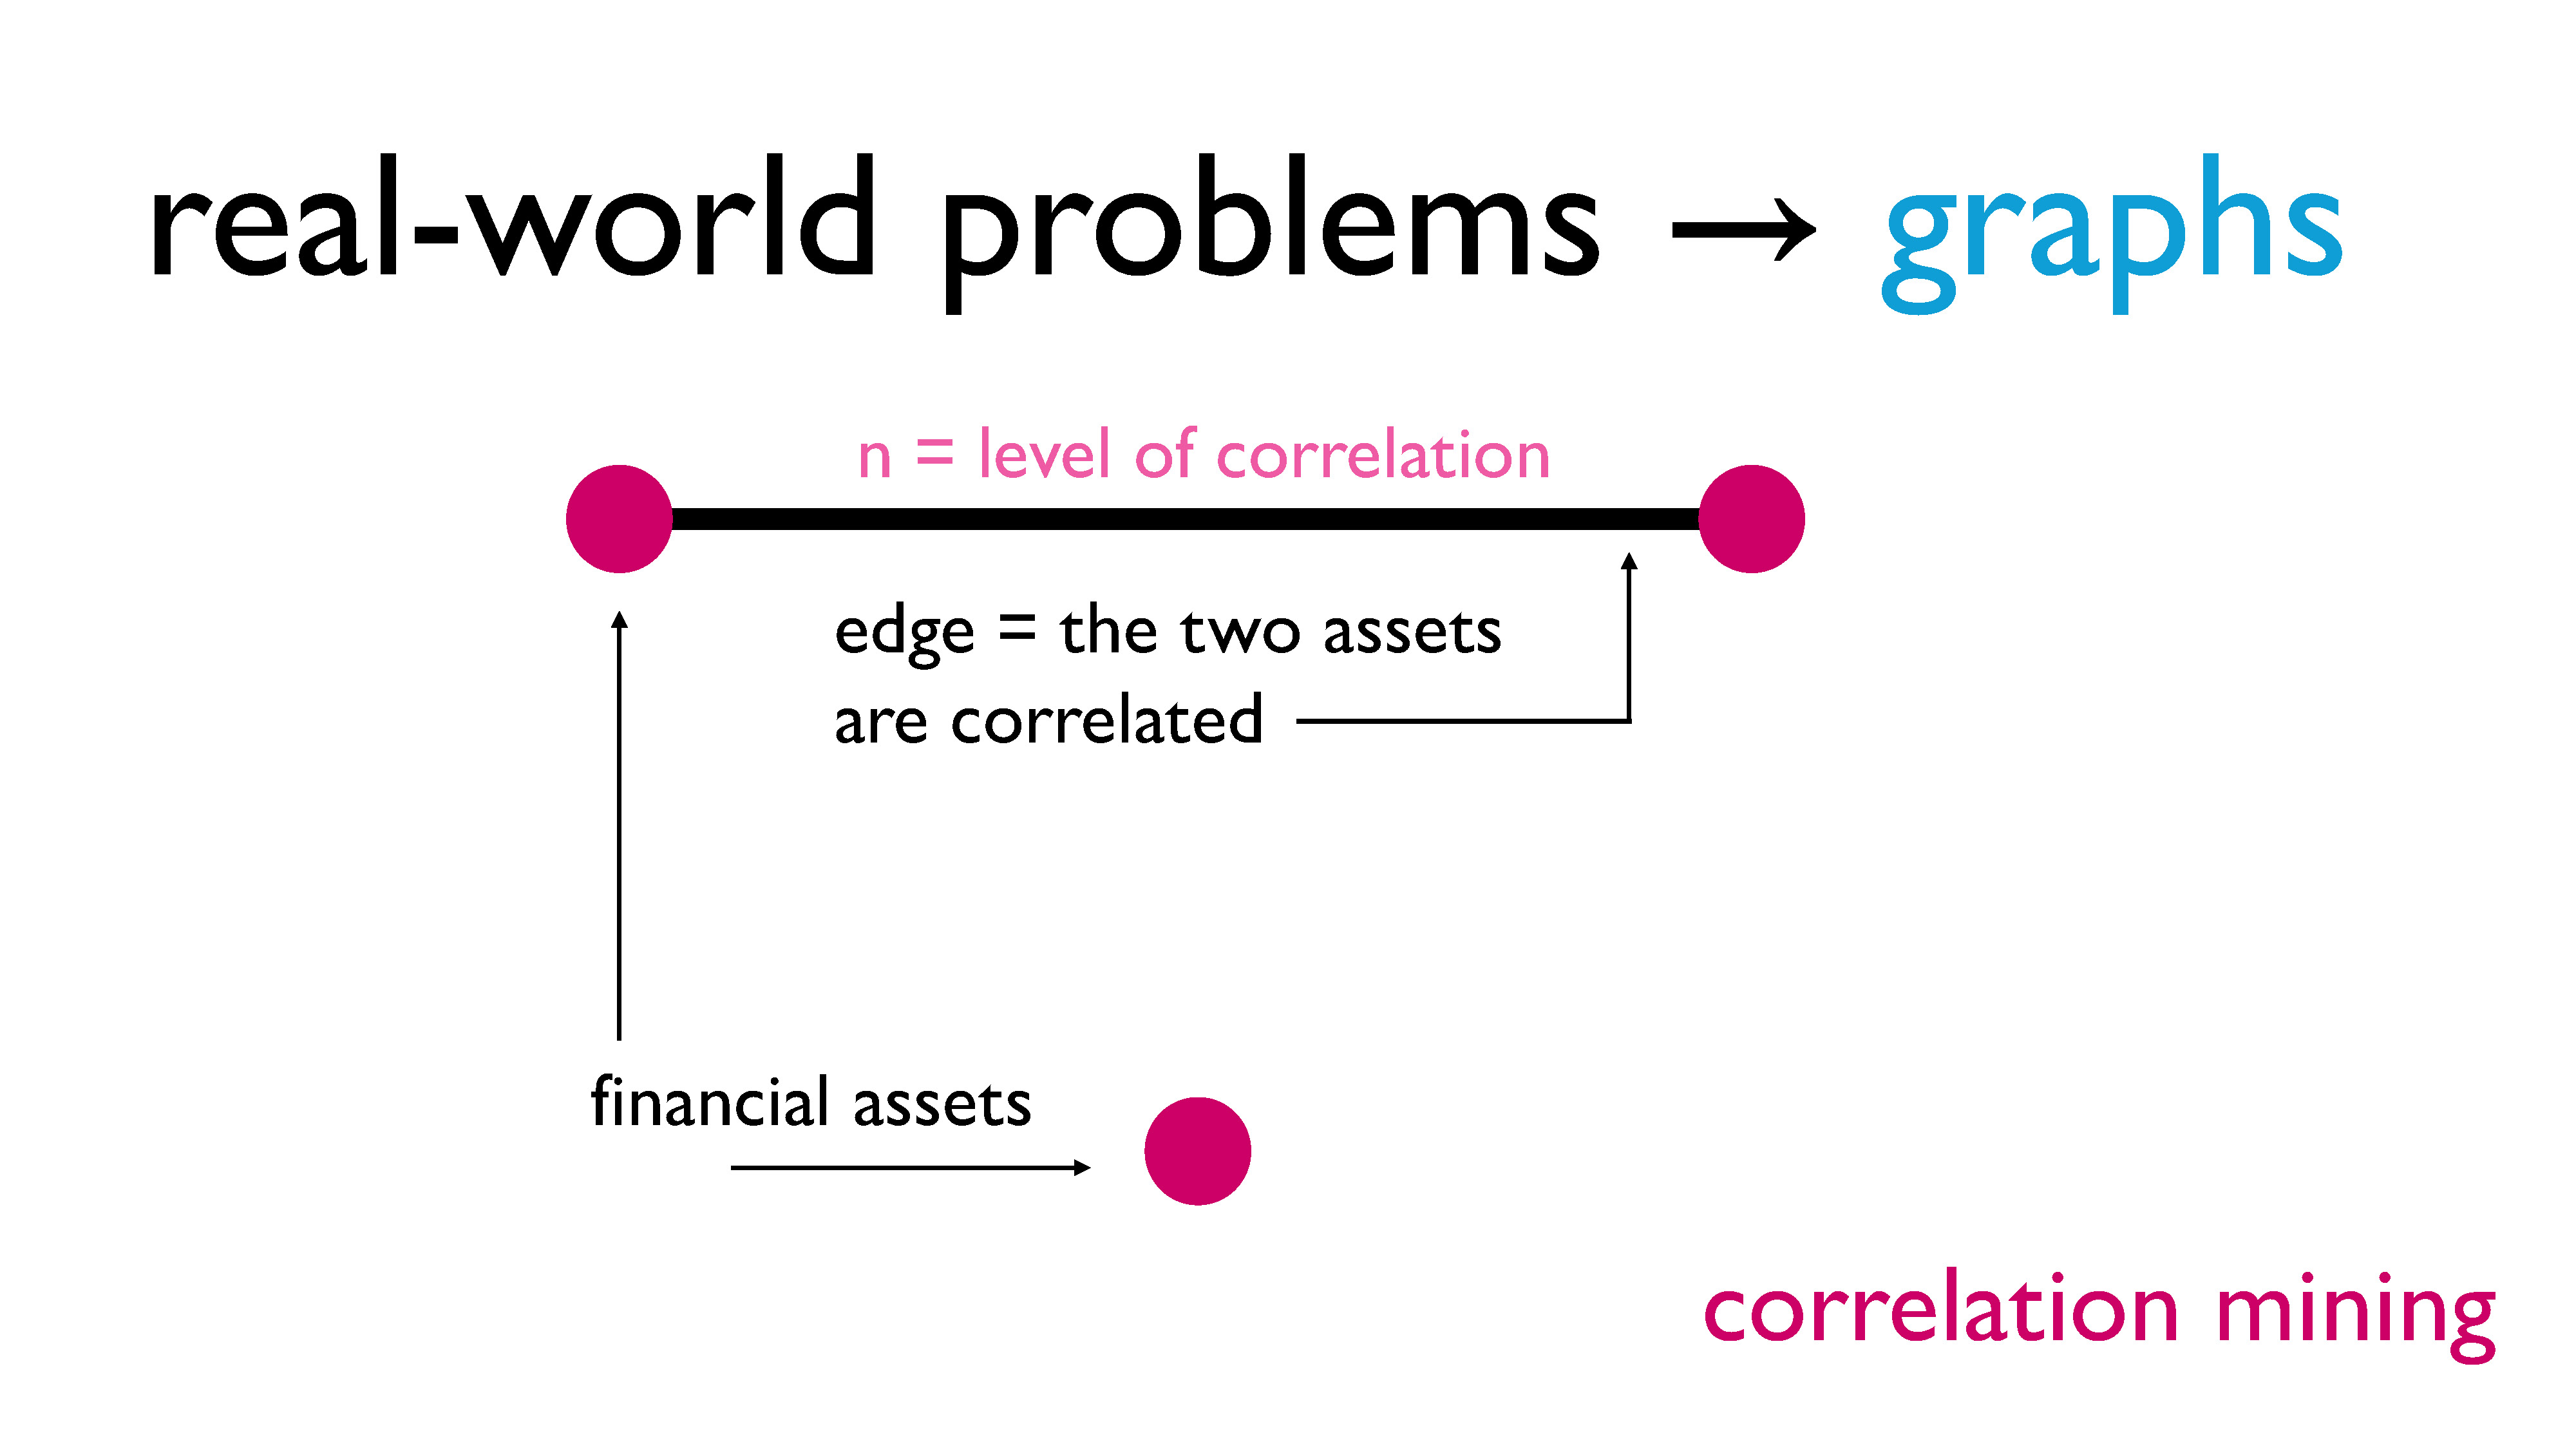
For financial correlation mining, our nodes are assets, and we put an edge between two nodes if the two assets are correlated – that is, if they have a direct influence on each other.
Now we know we can represent all of our previous problems as graphs!
To conclude this section, let’s revisit the notion of large near-clique extraction. We just learned that a clique is a subgraph in which each vertex shares an edge with every other vertex in the subgraph. A near-clique, then, is a subgraph in which each vertex shares an edge with most of the other vertices in the subgraph.
What these problems all have in common is that finding the largest near-clique is a pretty good way of identifying the “most important” objects. We’ll be identifying how exactly we can find such a subgraph when we look at the densest subgraph problem more closely in Part 3.
Part 3 of this talk is now available here!